
EV/EBITDA: The Smart Investor’s Secret Weapon for Accurate Stock Valuation

Video: ROIC Samjhiye — Return on Invested Capital Se Multibagger Stocks Ki Pehchan Kaise Karein (Hindi)
April 2, 2026
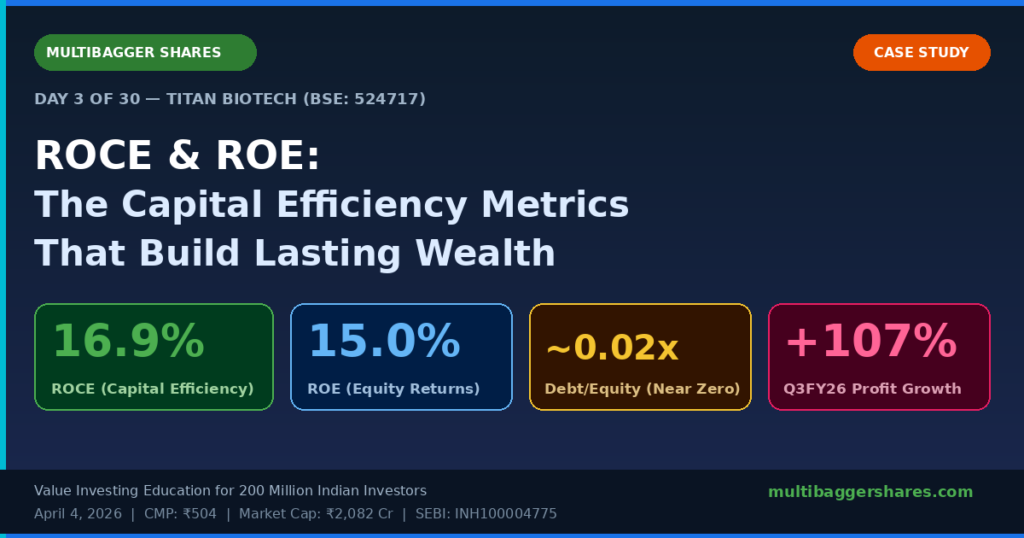
The Debt-Free Advantage: Why Titan Biotech’s Zero-Debt Balance Sheet Is Worth More Than Any Technical Chart — Fundamental Analysis Case Study #4
April 2, 2026Learn how EV/EBITDA — the valuation ratio used by institutional investors and private equity — can help you identify undervalued Indian stocks and multibagger opportunities with greater accuracy than the traditional P/E ratio.
Published: April 02, 2026 | By Manish Goel, SEBI RA INH100004775
When most investors talk about valuing a stock, they immediately reach for the Price-to-Earnings (P/E) ratio. It is simple, familiar, and widely quoted. But here is the truth: P/E can be dangerously misleading, especially when comparing companies with different debt levels, tax structures, or capital-intensive business models.
Enter EV/EBITDA — the Enterprise Value to EBITDA ratio. This is the metric that sophisticated institutional investors, private equity professionals, and experienced fund managers use to get a true picture of a company’s value. In this post, we break it down completely — what it is, why it matters, how to calculate it, and how you can use it to find multibagger opportunities in Indian equities.
What Is Enterprise Value (EV)?
While Market Capitalisation tells you what the equity holders own, Enterprise Value tells you the total cost of acquiring the entire business — including its debt.
EV = Market Cap + Total Debt – Cash and Cash Equivalents
Think of it this way: if you want to buy a house worth Rs 1 crore but it has a Rs 40 lakh mortgage, the real cost to you is Rs 1 crore. You are taking on the liability too. Enterprise Value applies the same logic to companies.
For example, if a company has Market Cap of Rs 500 crore, Debt of Rs 150 crore, and Cash of Rs 50 crore, then EV = Rs 500 + Rs 150 – Rs 50 = Rs 600 crore.
What Is EBITDA?
EBITDA stands for Earnings Before Interest, Taxes, Depreciation, and Amortisation. It is the most widely accepted proxy for a company’s operating cash flow generation capacity — stripping away financing decisions (interest), accounting choices (depreciation/amortisation), and tax jurisdictions.
EBITDA = Net Profit + Interest + Tax + Depreciation + Amortisation
Or alternatively: EBITDA = Operating Profit (EBIT) + Depreciation + Amortisation
EBITDA is particularly powerful for capital-intensive industries like steel, cement, telecom, and infrastructure; cross-company comparisons within a sector; businesses that are heavily depreciated such as manufacturing firms; and companies with high leverage that distort net profit.
The EV/EBITDA Formula
EV/EBITDA = Enterprise Value divided by EBITDA
This ratio answers a fundamental question: “How many years of EBITDA would it take to pay for the entire enterprise?” A lower EV/EBITDA suggests the company may be undervalued relative to its earnings power. A higher ratio may indicate overvaluation or high growth expectations priced in by the market.
General Interpretation Framework
| EV/EBITDA Range | General Interpretation |
|---|---|
| Below 6x | Potentially deep value / undervalued |
| 6x to 10x | Fairly valued (varies by sector) |
| 10x to 15x | Growth premium priced in |
| Above 15x | High growth expectations / rich valuation |
Note: These ranges vary by sector. IT and FMCG companies typically trade at higher multiples than commodity or cyclical businesses.
Why EV/EBITDA is Superior to the P/E Ratio
The P/E ratio has a fatal flaw: it only looks at equity value and net profit. This means two companies in the same industry — one debt-laden and one debt-free — will show very different P/E ratios even if their underlying business is equally strong.
Consider two hypothetical companies, Company A and Company B, both in the infrastructure sector. Both have Market Cap of Rs 1,000 crore and both generate EBITDA of Rs 200 crore. But Company B has Rs 500 crore of debt and only Rs 50 crore cash, while Company A is debt-free with Rs 100 crore cash.
Company A: P/E = 8.3x, EV/EBITDA = 4.5x. Company B: P/E = 16.7x, EV/EBITDA = 7.25x.
At first glance, Company B’s P/E of 16.7x looks expensive versus Company A’s 8.3x. But the difference is purely structural — Company B has more debt, which increases interest costs and reduces net profit. EV/EBITDA correctly captures the difference in leverage and allows an apples-to-apples comparison.
EV/EBITDA Benchmarks for Key Indian Sectors
In the Indian equity market, EV/EBITDA is particularly relevant for understanding sector-specific valuations:
- Cement: Typically trades at 8 to 14x EV/EBITDA depending on capacity utilisation
- Steel and Metals: Cyclical — can drop to 3 to 5x at bottom of cycle, offering compelling entry points
- FMCG: Premium multiples of 20 to 35x justified by high margins and brand strength
- Telecom: High depreciation and amortisation makes EBITDA the most relevant metric; typically 5 to 9x
- Pharma: 10 to 20x range depending on R&D pipeline and export mix
- IT Services: Asset-light model; multiples of 15 to 25x are common given high margins and low capex
Step-by-Step: How to Calculate EV/EBITDA Using Screener.in
You do not need a Bloomberg terminal to calculate EV/EBITDA. India’s most powerful free stock research tool — Screener.in — gives you everything you need in minutes.
- Go to Screener.in and search for your target company
- Note the Market Cap from the summary section
- Find Total Debt from the Balance Sheet tab
- Find Cash and Equivalents from the Balance Sheet
- Calculate EV = Market Cap + Debt – Cash
- Go to the P and L tab — EBITDA is often shown directly, or calculate as Operating Profit + Depreciation
- Divide EV by EBITDA to get the ratio
- Compare with sector peers and the company’s own historical average
Common Mistakes Investors Make with EV/EBITDA
1. Ignoring sector context: A software company at 20x EV/EBITDA may be perfectly reasonable, while a commodity trader at the same multiple could be dangerously overvalued. Always compare within the sector.
2. Not adjusting for growth: A company growing EBITDA at 30% YoY deserves a higher multiple than one with flat growth. Consider the EV/EBITDA-to-growth ratio when comparing high-growth and low-growth businesses.
3. Taking EBITDA at face value: Some companies manipulate working capital or capitalise expenses to inflate reported EBITDA. Always cross-check with actual Operating Cash Flow from the Cash Flow Statement. For strong businesses, OCF should be 70 to 90 percent of EBITDA.
4. Using only trailing numbers: Trailing EV/EBITDA uses past numbers. For growing companies, look at forward EV/EBITDA based on your projections — the forward multiple reveals whether the market is correctly pricing future growth.
EV/EBITDA in a Multibagger Framework
The most powerful stock analysis combines EV/EBITDA with complementary signals to build deep conviction:
- EV/EBITDA + Revenue Growth: High growth combined with low EV/EBITDA = strong multibagger candidate
- EV/EBITDA + EBITDA Margin Trend: Expanding margins with low EV/EBITDA = operational leverage opportunity about to unlock
- EV/EBITDA + Debt Reduction: Companies paying down debt see EV fall even as EBITDA potentially grows — creating a powerful double compression benefit to the ratio
- EV/EBITDA + Sector Tailwinds: Cheap EV/EBITDA in a sector experiencing structural growth is the ideal setup for long-term wealth creation
Limitations to Keep in Mind
No metric is perfect, and EV/EBITDA has important limitations: it is not suitable for financial sector companies (banks, NBFCs, insurance) where debt is a business input rather than a liability; it does not account for working capital requirements; and in capital-intensive businesses, ignoring real economic depreciation can be misleading. Always use EV/EBITDA as part of a holistic analytical framework, not in isolation.
Conclusion: Make EV/EBITDA Your Core Valuation Tool
EV/EBITDA is not just a metric — it is a lens that reveals the true economic value of a business, independent of its capital structure. It levels the playing field between leveraged and unleveraged companies, enables meaningful peer comparisons, and helps you identify when the market is irrationally pricing a fundamentally strong business.
The next time you evaluate a stock, do not just ask “What is the P/E?” Ask: “What is the EV/EBITDA, how does it compare to peers, and what is the historical trend?” That single shift in thinking can make a profound difference in your long-term investment outcomes.
📱 Join our Telegram channel for daily stock insights: t.me/longtermequityy
🎓 Watch our complete Value Investing Course playlist on YouTube: Click Here to Access the Full Course
Disclaimer: This content is for educational purposes only. Manish Goel — SEBI RA INH100004775 | Multibagger Securities — SEBI IA INA100007736. All investments are subject to market risk. Please consult your financial advisor before making investment decisions.


