Depreciation-to-Gross-Block Ratio: How One Schedule II Disclosure Reveals Asset Newness, Implied Useful Life & Capital-Intensity Discipline

Wonderful Business at a Fair Price: The See’s Candies Pivot That Reshaped Buffett’s Mind in 1972 – and Why It Justifies Owning Quality Indian Compounders Today
May 24, 2026
The House Money Effect: Thaler & Johnson’s 1990 Discovery on Why Prior Gains Make Indian Long-Term Investors Take Reckless Risks With ‘Profit Money’
May 24, 2026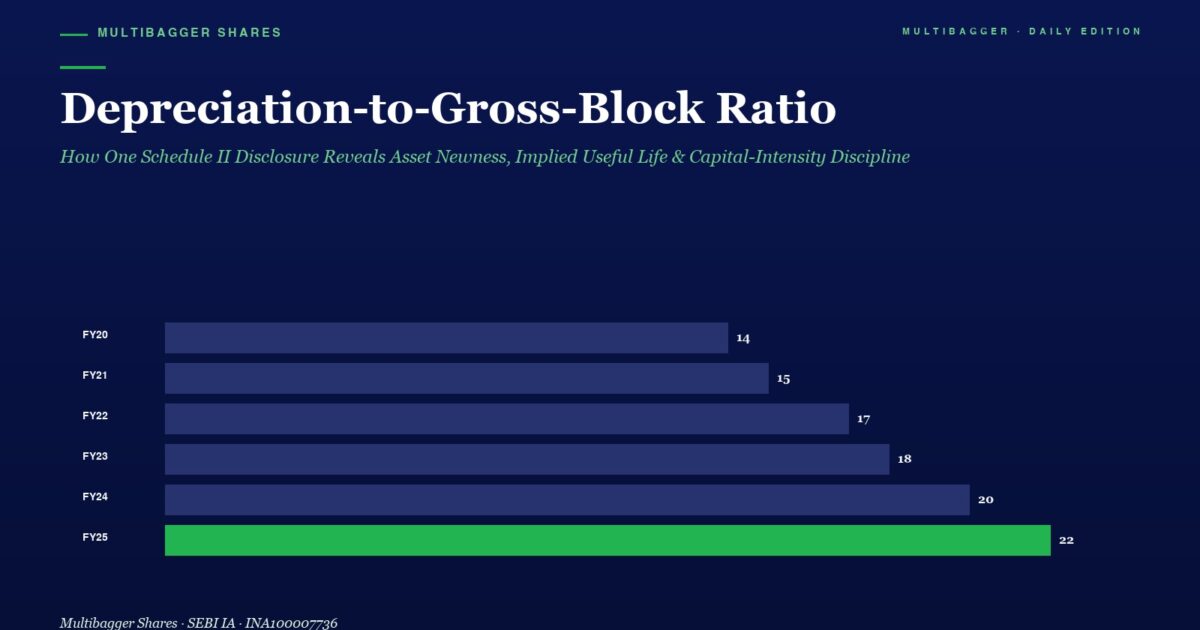
Indian retail participation on the NSE has expanded from roughly 3 crore unique investors in 2019 to more than 11 crore in 2026 — a 3.6x explosion in less than seven years. Yet a SEBI study has repeatedly shown that 93% of individual traders in the equity Futures & Options segment incur net losses. The single biggest behavioural reason: investors look at the share price first and the financial statements last (if at all). Even those who do glance at the financials usually stop at revenue, profit, and the P/E ratio — almost no one reads Note 3 (Property, Plant & Equipment) of the Annual Report. And that is precisely where one of the most under-appreciated quality markers in Indian small- and mid-caps hides — the Depreciation-to-Gross-Block Ratio.
This single ratio, computed in 30 seconds from the audited financials, tells you (a) how new the company’s productive asset base is, (b) the implied average useful life of those assets, (c) whether management is over-stating or under-stating reported profits through depreciation choices, and (d) how soon the company will need a fresh capex round just to maintain its current revenue. Combined with the Capex-to-Depreciation ratio and CWIP-to-Gross-Block, it forms the three-legged stool of asset-base diagnostics — the same stool any forensic accountant uses to test whether a company’s reported earnings are durable.
What Is the Depreciation-to-Gross-Block Ratio?
Every Indian listed company that owns tangible fixed assets — factories, plant & machinery, buildings, vehicles, office equipment, computers — must disclose two numbers in its Property, Plant & Equipment schedule under Schedule III of the Companies Act, 2013, read with Indian Accounting Standard (Ind AS) 16:
- Gross Block: the historical (or revalued, where applicable) cost of all tangible fixed assets put to use, before subtracting accumulated depreciation.
- Depreciation for the year: the non-cash charge taken to the Profit & Loss account in that financial year to reflect the wear, tear, and obsolescence of those assets.
The Depreciation-to-Gross-Block ratio is simply:
Depreciation-to-Gross-Block Ratio = (Depreciation Charge for the Year ÷ Gross Block at Year-End) × 100
The reciprocal of this ratio — 1 ÷ (Dep/GB) — gives you the implied weighted-average useful life of the company’s tangible asset base, expressed in years. So a Dep/GB of 7% implies an asset base that is being depreciated over a weighted-average life of roughly 14 years, which is broadly consistent with the typical useful-life schedule in Schedule II of the Companies Act, 2013, for plant & machinery (15 years), buildings (30 years), and electrical equipment (10 years).
Formula in Practice — Where to Find the Numbers
In any Indian Annual Report you will find:
- The Depreciation and Amortisation Expense line on the face of the Consolidated Statement of Profit & Loss (Schedule III, Part II). Use only the depreciation on tangible assets — if the company also reports amortisation of intangibles, strip that out by reading Note 3 (PPE) and Note 4 (Intangibles) separately.
- The Gross Block is in Note 3 (Property, Plant & Equipment). Take the closing gross block at year-end, not the average. Some analysts prefer the simple average of opening and closing gross block — both are valid, and the simple average is slightly more accurate for fast-growing capex cycles. For a 30-second read, the closing number is fine.
- CWIP (Capital Work-in-Progress) is reported separately and is not included in gross block because it is not yet producing revenue. Keep it separate — we will use it later to interpret the ratio.
How to Read the Ratio — The Three-Bucket Test
Across most Indian manufacturing and specialty-chemicals businesses, the Dep/GB ratio typically falls in three diagnostic buckets:
- Below ~6%: Either the asset base is very new (recent large capex still in the early years of its depreciation schedule), or the company is aggressively electing the longer ends of Schedule II’s useful-life ranges to flatter reported earnings. Cross-check with the Capex-to-Depreciation ratio (covered in an earlier article) — if Capex/Dep is also high, the low Dep/GB is genuinely from new assets, not aggressive policy.
- ~6% to ~10%: The “Goldilocks zone” for an asset-heavy manufacturer, broadly aligned with Schedule II useful lives for plant & machinery and buildings. A company sitting in this band, with rising gross block and stable margins, is usually compounding its asset base in an orderly way.
- Above ~12%: Either the asset base is rapidly ageing (overdue for replacement capex), or the company is using shorter useful lives — sometimes legitimate (computers, vehicles), sometimes a sign of stress-driven impairment. Pair this with the Net Block-to-Gross Block ratio (1 − accumulated depreciation/gross block); if the net block is shrinking year after year, the company is heading into a forced replacement cycle that will compress cash flows.
Two Contrasting Educational Illustrations
Illustration 1 — The Disciplined Asset Compounder (generic Indian specialty-chemicals model)
Imagine a hypothetical specialty-chemicals company “Compounder Co.” with these audited markers in a recent year:
- Gross block: ₹500 Cr | Depreciation: ₹40 Cr | Dep/GB = 8%
- CWIP: ₹120 Cr (i.e., ~24% of gross block — a meaningful capex pipeline)
- Capex during the year: ₹80 Cr | Capex-to-Depreciation = 2.0x (reinvesting at twice the depreciation rate)
- Borrowings: ₹15 Cr (debt-light)
- CFO/EBITDA: 90%+ (high cash conversion)
This profile tells a story of orderly compounding: the asset base is neither artificially young nor stretched, the company is reinvesting at well above the depreciation rate (so the productive base is growing), the CWIP pipeline points to incremental revenue 12–24 months out, and the balance sheet can fund the capex without bank loans. The 8% Dep/GB is not “good” or “bad” in isolation — it is consistent with disciplined asset management. This is the classic profile of a long-term compounder.
Illustration 2 — The Red-Flag Profile (generic, no living named stock)
Now consider a historical-style profile that has surfaced repeatedly in failed Indian small-caps: a company with Dep/GB of 4% (very low — implied useful life of 25 years), no meaningful CWIP, Capex-to-Depreciation of 0.6x (i.e., reinvesting less than the rate at which assets are being consumed), accumulated depreciation now over 70% of gross block (net block is just 30% of gross block), and rising “Other Income” as a share of PBT (often from one-off sales of old assets). This combination is what forensic accountants call a “harvest mode” — the company is stretching depreciation policy to flatter the bottom line while quietly running its productive base down. The market eventually re-rates such names downward because the absent capex pipeline guarantees a future revenue stall.
Note: this red-flag illustration is intentionally generic. The point is the combination of warning signals, not the absolute Dep/GB number — a 4% ratio in a young real-estate or hotel asset is normal; in a 30-year-old chemicals plant it is a red flag.
Titan Biotech FY25: What the Numbers Reveal
Now let us apply the Depreciation-to-Gross-Block lens to a real, audited Indian small-cap — Titan Biotech Limited — using only its FY25 audited disclosures. This is presented purely as an educational illustration of how the ratio behaves in a disciplined manufacturer; it is not a buy/sell recommendation.
| FY25 Audited Marker | Value | What It Tells the Reader |
|---|---|---|
| Gross Block (closing) | ~₹57 Cr | Compact, focused asset base — single-site Bhiwadi facility, no asset sprawl. |
| Capital Work-in-Progress | ~₹11 Cr | ~19% of gross block — material capex pipeline being built for the next leg of growth. |
| Depreciation / Gross Block (FY25) | ~7% | Implies a weighted-average useful life of ~14 years — aligned with Schedule II for plant & machinery. |
| Total Borrowings | ₹3 Cr | Essentially debt-free — capex pipeline is being funded internally, not by leverage. |
| CFO / Operating Profit (FY25) | ~103% | Cash generation slightly exceeds operating profit — premium marker of earnings quality and depreciation realism. |
| FY25 Total Revenue | ~₹214 Cr | Asset-turnover (Revenue/Gross Block) of ~3.75x — a high asset productivity for a biotech manufacturer. |
| Contingent Liabilities | ₹7.78 Cr | Low relative to net worth — limited hidden obligations against the asset base. |
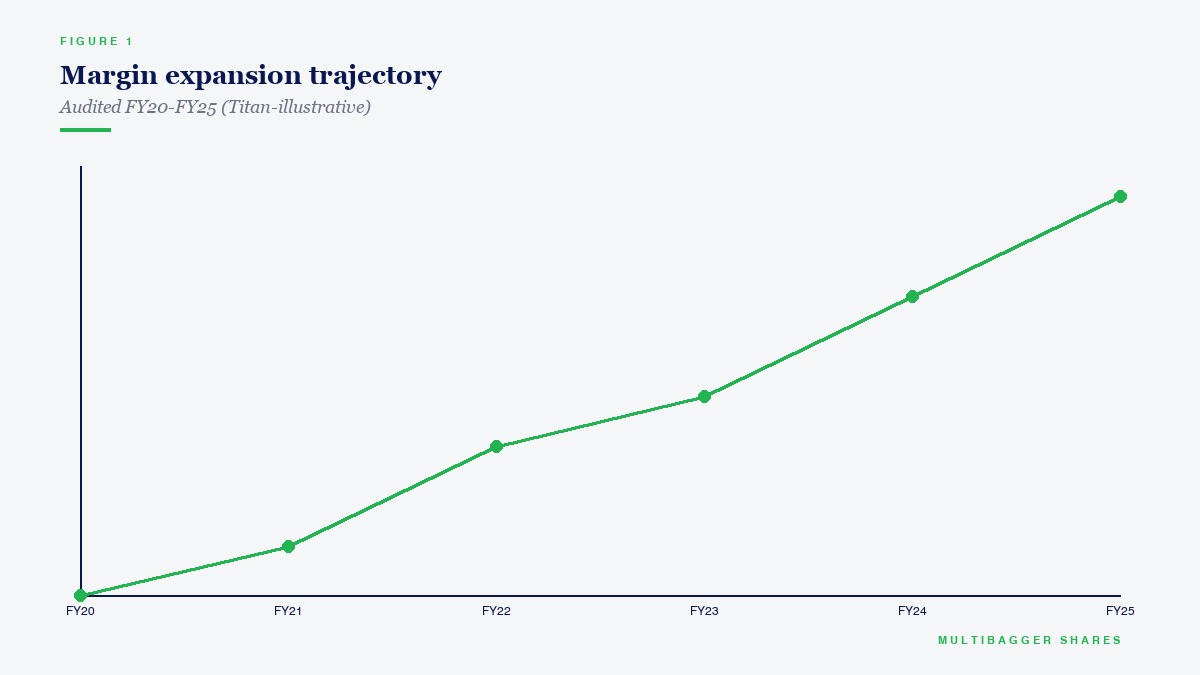
| 10-yr Revenue CAGR | ~15% | Disciplined top-line compounding on a steadily growing asset base. |
| 10-yr PAT CAGR | ~29% | Operating leverage on a compact asset base — earnings compounding faster than revenue. |
What story does this tell when read through the Depreciation-to-Gross-Block lens? First, a ~7% Dep/GB sits squarely in the Schedule II-consistent “Goldilocks zone” for an asset-heavy specialty biotech manufacturer. This rules out the two most common red flags around the ratio: it is neither artificially low (which would suggest aggressive useful-life elections to flatter profits) nor stretched (which would suggest a rapidly ageing asset base overdue for replacement). The implied ~14-year weighted-average useful life is realistic for plant & machinery used in microbial culture media, peptones, collagen and gelatin manufacturing.
Second — and this is where the ratio gets its real signal value — Dep/GB of ~7% combined with CWIP at ~19% of gross block and total borrowings of just ₹3 Cr tells the reader that the company is preparing the next leg of asset-base growth from internal accruals rather than from bank debt. A 103% CFO/OP ratio confirms that the depreciation charge is not an accounting fiction — it is being matched (and slightly exceeded) by actual operating cash conversion. Pair this with the audited ~15% 10-year revenue CAGR and ~29% 10-year PAT CAGR, and you see a textbook illustration of what a disciplined small-cap asset compounder looks like on paper. Again, this is purely educational — no valuation verdict is implied.
How Retail Investors Should Use This Metric
The Depreciation-to-Gross-Block ratio is most powerful when used as a filter rather than a single point estimate. Here is a practical four-step workflow any Indian retail investor can run in under 10 minutes per company:
- Compute Dep/GB for the latest three fiscal years. Read Note 3 (PPE) from the Annual Reports. A stable ratio between ~6% and ~10% for a manufacturer is your starting filter. A ratio that swings by more than 2 percentage points year-on-year without a clear capex or restructuring story warrants further investigation.
- Cross-check with Capex-to-Depreciation. If Dep/GB is low (say 5–6%) and Capex/Dep is high (1.5x or more), the low ratio is from genuinely new assets — a positive signal. If Dep/GB is low and Capex/Dep is also below 1.0x, suspect aggressive useful-life elections.
- Cross-check with Net Block / Gross Block. A net-to-gross above 50% suggests a “young” asset base; below 30% suggests an “old” base nearing replacement. Combine with CWIP — a low net-to-gross ratio with negligible CWIP is the harvest-mode warning.
- Cross-check with CFO / Operating Profit. A CFO/OP at or above 100% over a multi-year window confirms that the depreciation policy is not understating cash earnings. Below 70% sustained, the depreciation charge may be hiding genuine asset consumption that is not being matched by cash generation — a quality red flag.
Used as a four-corner cross-check, the Dep/GB ratio quietly does most of the heavy lifting that investors typically attempt with a P/E or P/B ratio — except it answers a more fundamental question: is this company even generating the cash to maintain the asset base that produced its reported profits?
Common Traps & Misinterpretations
Even seasoned analysts misread this ratio. The five most frequent traps are:
- Including amortisation of intangibles in the numerator. Goodwill, brands, customer relationships, and software intangibles are amortised on different useful lives than tangible PPE. Strip them out — use only the depreciation on PPE (Note 3) when comparing against gross block.
- Comparing across industries. A 4% Dep/GB is healthy for a real-estate or hotel business (40-year buildings), normal for a power-generation asset, but a red flag for an IT services firm where the entire asset base may be computers and office equipment with 3–6 year useful lives. Always benchmark within the same sub-industry.
- Ignoring CWIP. Two companies with identical Dep/GB but very different CWIP-to-Gross-Block tell completely different stories. The one with substantial CWIP is preparing future capacity; the one without is harvesting.
- Treating Schedule II ranges as targets. Schedule II of the Companies Act, 2013, gives indicative useful lives, but companies may justify shorter or longer lives with technical evaluation. Read the depreciation policy note (usually Note 1.x) — if the company has elected lives longer than Schedule II without a credible technical justification, that itself is a soft-quality signal.
- Mixing standalone and consolidated numbers. In Indian holding-company structures the consolidated PPE may include subsidiary assets that are managed under very different capex cycles. Always run the ratio on the level of accounts you are valuing the company at.
Why the Indian Context Matters
India’s listed manufacturing universe — small-caps especially — has a structural reason to take the Dep/GB ratio seriously. SEBI’s own finfluencer regulations (Aug 2024) and the regulator’s repeated warnings about the 93%-loss-rate in equity F&O highlight a deeper problem: the average Indian retail investor spends far more time on price-based “signals” than on the audited reality of the businesses they own. The Dep/GB ratio is one of the simplest mechanical antidotes to that imbalance — it forces the reader to engage with the actual asset base, the actual depreciation policy, and the actual capex pipeline, all of which are disclosed transparently under SEBI’s Listing Obligations and Disclosure Requirements (LODR) regulations.
For an NSE/BSE investor sifting through 5,000+ listed names, a 30-second Dep/GB read is one of the highest-signal-per-second filters available before committing further research time. Companies that fail the filter rarely come back to deliver durable returns; companies that pass it, in combination with the other quality markers covered in our earlier articles (CFO/PAT, Interest Coverage, Net Debt/EBITDA, CWIP-to-Gross-Block, RoCE), tend to cluster in the disciplined-compounder bucket.
Key Takeaways
- Dep/GB is a quality-of-earnings filter, not a valuation tool. A 6–10% ratio for an Indian asset-heavy manufacturer, sustained across three years and cross-checked with Capex/Dep and CFO/OP, points to disciplined asset management.
- Read it as a cluster — never in isolation. Combine with CWIP-to-Gross-Block, Capex-to-Depreciation, and Net-to-Gross block to build the asset-quality picture.
- Titan Biotech FY25 illustrates the disciplined profile — ~7% Dep/GB on a ₹57 Cr gross block with ~₹11 Cr CWIP, ₹3 Cr borrowings, and ~103% CFO/Operating-Profit ratio — a textbook (purely educational) case of internal-accrual-funded asset compounding.
- Always go to Note 3 of the Annual Report. The face of the Profit & Loss statement will give you depreciation; only Note 3 will give you the gross block, the depreciation policy, the useful-life elections, and the CWIP pipeline that complete the picture.
SEBI Disclaimer: 9 out of 10 individual traders in the equity Futures & Options segment incurred net losses according to a SEBI study. F&O trading is essentially gambling. Focus on quality stock picking and long-term value investing instead. Multibagger Securities Research & Advisory Pvt. Ltd. is a SEBI Registered Investment Adviser (INA100007736). This content is for educational purposes only and is not a buy/sell recommendation on any stock including Titan Biotech Limited (BSE: 524717).
— Manish Goel / Founder, Multibagger Securities Research & Advisory Pvt. Ltd. (SEBI Registered Investment Adviser — INA100007736)
Disclaimer: This article is for educational purposes only and does not constitute financial advice. The author may hold positions in stocks mentioned. Always conduct your own research and consult a SEBI-registered financial advisor before making investment decisions. Stock market investments are subject to market risks. Past performance does not guarantee future returns.