Behavioral Finance

July 20, 2026
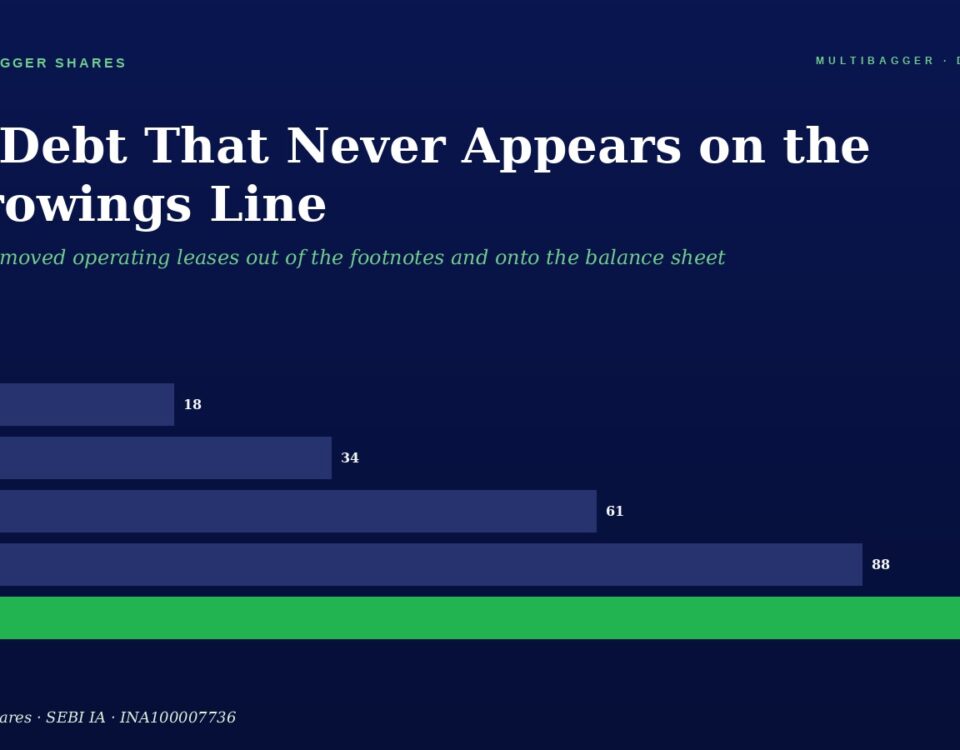
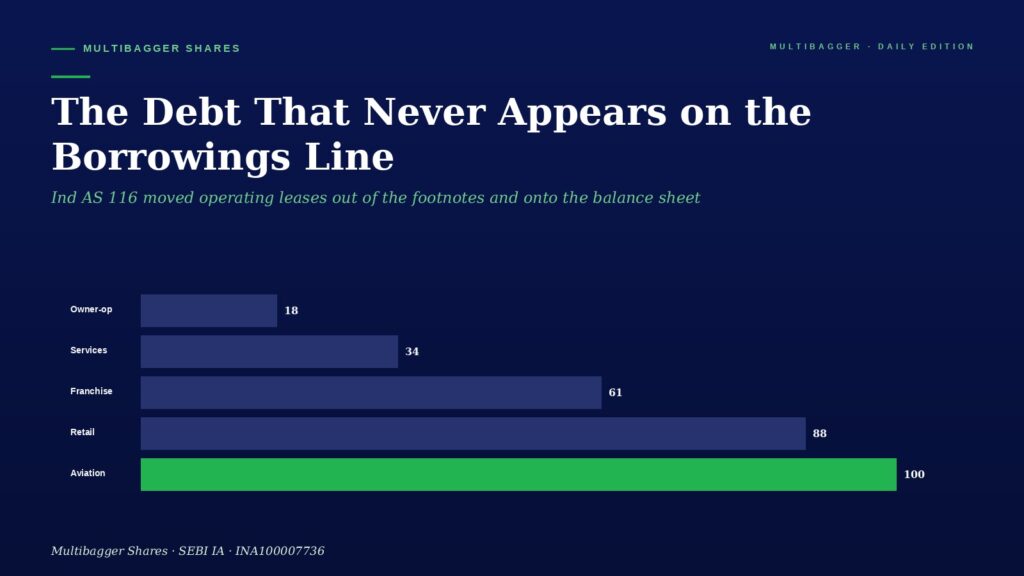
Infographic with dark blue background showing debt categories as horizontal bars: Owner-op 18, Services 34, Franchise 61, Retail 88, Aviation 100 (green bar).

Lease Liabilities and Right-of-Use Assets: How Ind AS 116 Dragged India’s Off-Balance-Sheet Debt Into the Open

Since FY20, Ind AS 116 has required lease liabilities on the balance sheet. The Borrowings line is no longer the whole story of what a company owes.
June 5, 2026
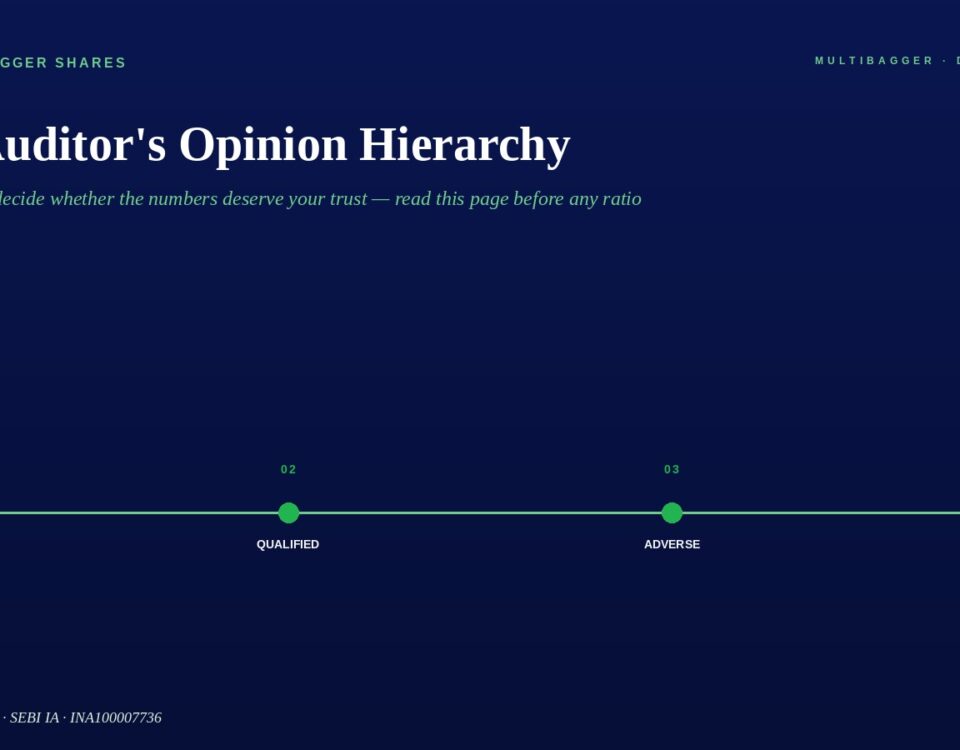
The Auditor's Opinion Hierarchy title with a four-step green timeline: Unqualified, Qualified, Adverse, Disclaimer.

The Auditor’s Opinion Hierarchy: How Unqualified, Qualified, Adverse & Disclaimer Reports Reveal Whether the Numbers Deserve Your Trust

India’s registered investor base has nearly quadrupled — from roughly 3 crore to more than 11 crore unique investors on the NSE in just a few […]
June 4, 2026
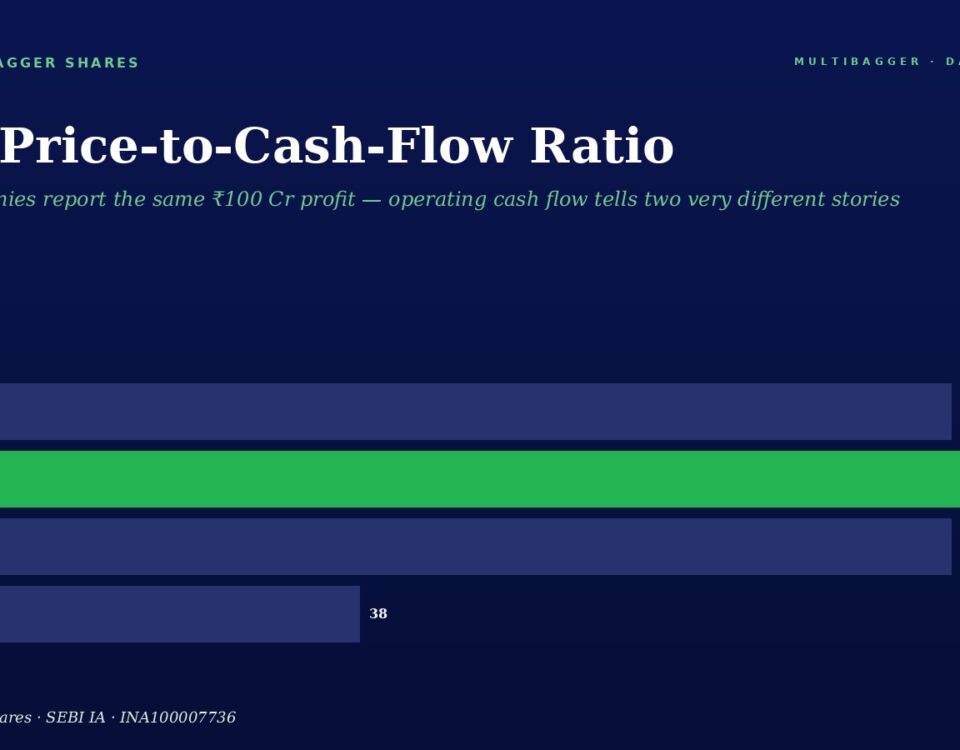
Bar chart on a dark blue background comparing two companies: A profit 100 and cash 103; B profit 100 and cash 38 (blue profit bars, green cash bar).

Price-to-Operating-Cash-Flow (P/CFO) Ratio: The Valuation Multiple That Refuses to Trust Profits Until the Cash Arrives

India’s registered investor base has exploded from roughly 3 crore to more than 11 crore unique investors on the NSE in just a few years — […]
June 3, 2026
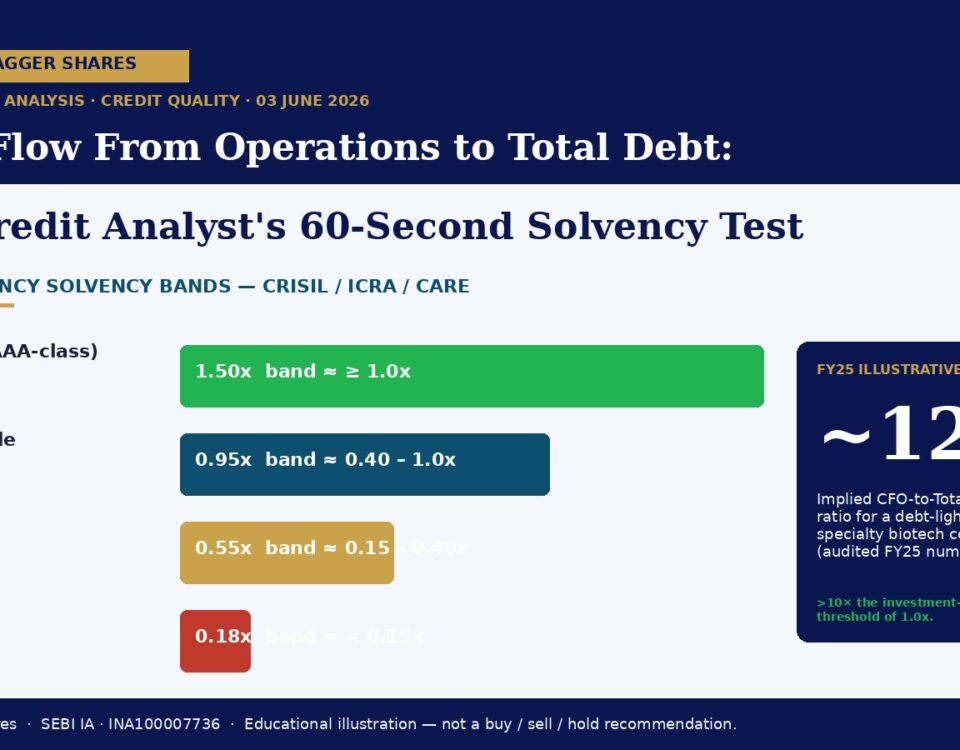
Infographic showing debt/FCF multipliers by category: Fortress 1.50x, Comfortable 0.95x, Stretched 0.55x, Distressed 0.18x and a FY25 marker around 12x for CFO-to-debt.

Cash Flow From Operations to Total Debt Ratio: The Credit-Analyst’s 60-Second Solvency Test That Separates Self-Liquidating Balance Sheets From Slow-Bleed Leverage Time Bombs

The Cash Flow From Operations to Total Debt ratio — CFO divided by Total Borrowings — is the single most under-appreciated solvency test in Indian fundamental analysis. This article walks through the formula, two contrasting cases, and a dedicated FY25 audited case study.
+91-8448836436