The Interest Coverage Ratio: How to Tell Whether a Company Can Actually Afford Its Debt

Three Honest Reasons to Sell a Stock — and Why “It Went Up” or “It Went Down” Isn’t One of Them
September 28, 2026
The Mango Tree Test: Raamdeo Agrawal’s Three Simple Questions for Judging a Business
September 29, 2026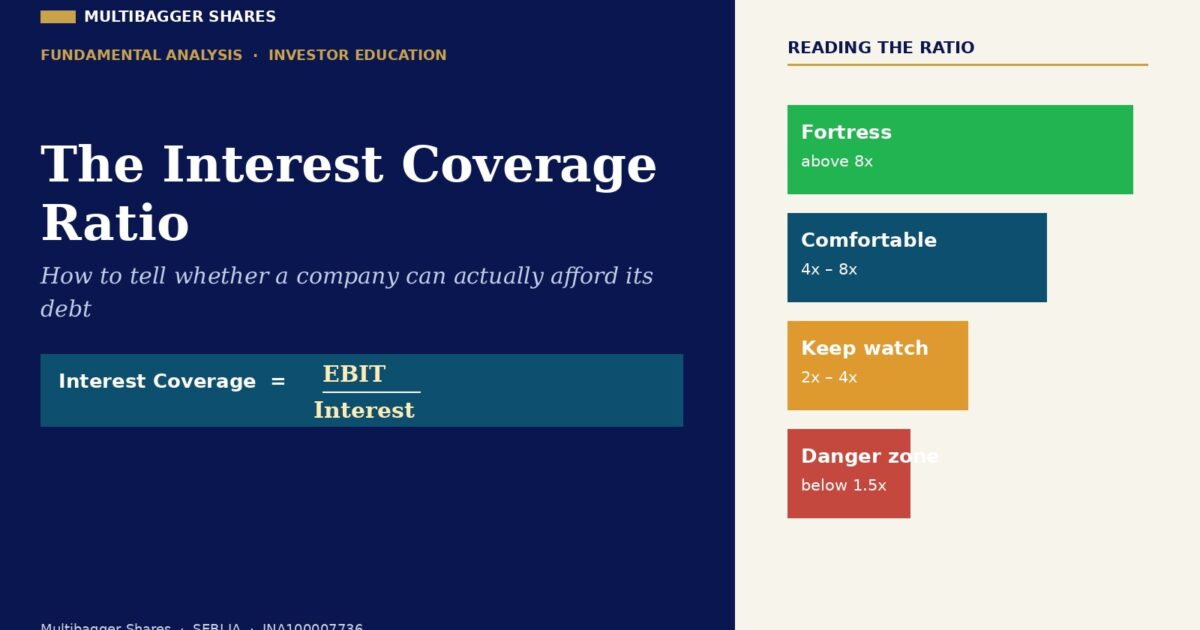
India now has more than 11 crore registered investors on the NSE, up from roughly 3 crore just before the pandemic. Most of that new money is learning the market in real time. And one of the plainest questions a new investor can ask about any company — can this business actually afford the debt it has taken on? — is answered by a single, humble ratio that rarely makes the headlines: interest coverage.
Debt is not the enemy. Used well, borrowed money lets a good business build a factory, buy a competitor, or fund a season’s inventory long before its own profits could pay for them. The problem is never that a company has debt. The problem is when the debt is larger than the business can comfortably service — when the interest bill quietly grows into a claim on profits so heavy that a single bad year can tip the whole company over. Interest coverage is the ratio that tells you, in one number, how much breathing room a company has between what it earns and what it owes its lenders.
This article explains what the interest coverage ratio is, how to calculate it from figures you can find in any annual report, how to read it sensibly, and — just as importantly — the traps that catch people who read it carelessly. Everything here is educational. It is not a recommendation to buy, sell, or hold any stock.
What the interest coverage ratio actually measures
Think of a household that earns ₹1,00,000 a month and has an EMI of ₹20,000. The EMI takes one-fifth of the income; four-fifths is left for everything else. That household could absorb a pay cut, a medical bill, or a slow month and still keep paying the EMI. Now picture a second household with the same ₹1,00,000 income but an EMI of ₹80,000. On paper both are “paying their EMI on time.” In reality the second household is one disruption away from missing a payment.
The interest coverage ratio applies exactly this logic to a company. It compares the profit a company earns from its core operations against the interest it must pay on its borrowings. A high ratio means the interest bill is a small slice of operating profit, and the company has room to spare. A low ratio means interest is eating most of what the business earns, and there is little cushion left for a downturn, a rate rise, or an unexpected shock.
The formula, and how to read it
The classic version of the ratio is simple:
Interest Coverage Ratio = Operating Profit (EBIT) ÷ Interest Expense
EBIT stands for earnings before interest and tax — the profit the business makes from operations before its lenders and the government take their share. You will find it (or the pieces to build it) on the profit-and-loss statement; the interest expense, sometimes called finance costs, sits a line or two below. Divide the first by the second and you get a multiple. A coverage of 6x means operating profit is six times the interest bill. A coverage of 1.2x means operating profit barely clears it.
There is no single “correct” number, because industries differ, but a rough reading many analysts keep in their heads looks like this. Above roughly 8x is a fortress balance sheet: interest is almost an afterthought. Between about 4x and 8x is comfortable. Between 2x and 4x is a zone to keep watching — fine in good times, but with less margin if profits dip. Below about 1.5x is a genuine danger zone, where a single weak year could leave the company unable to cover interest from its own operations. These bands are guides for thinking, not verdicts on any particular company.
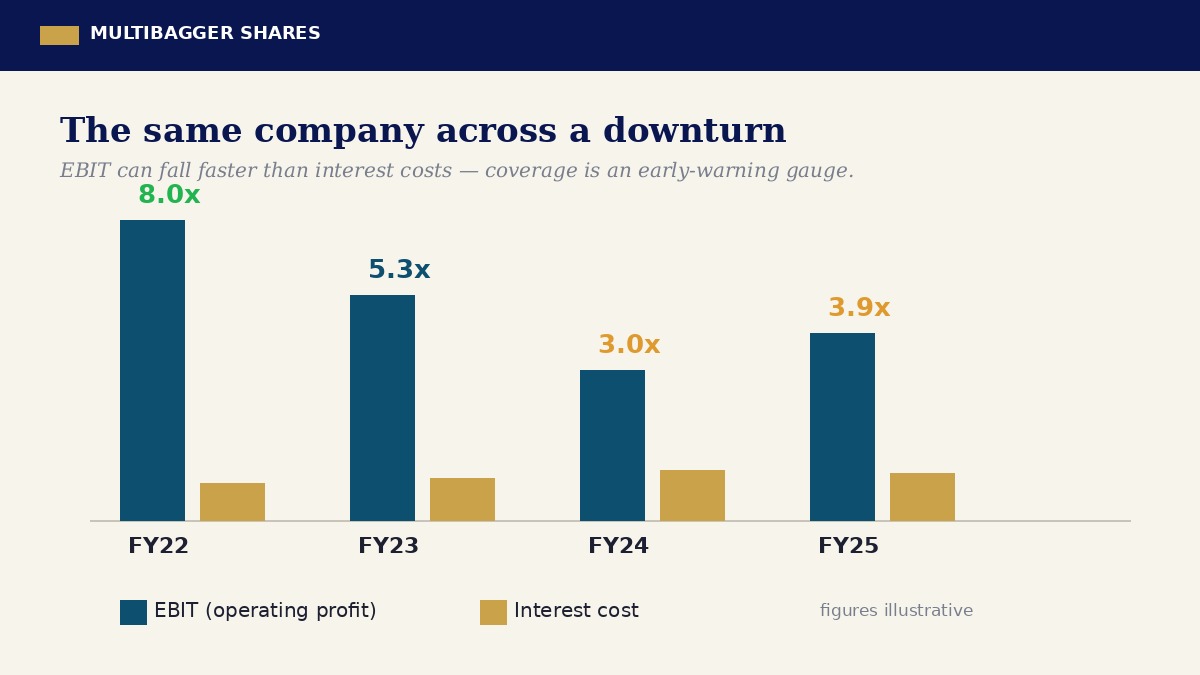
The chart above shows why the ratio is so useful as an early-warning gauge. The interest bill (the gold bars) barely moves from year to year — loans and their rates are relatively fixed. Operating profit (the teal bars) is the volatile part. So when business slows, coverage can collapse from a healthy 8x to an uncomfortable 3x in the space of two years, even though the debt itself has not grown. The ratio flashes a warning long before the company actually struggles to pay, which is precisely what you want from a safety gauge.
Two companies, same profit, very different safety
The clearest way to feel what the ratio is telling you is to line up two businesses that look identical on the profit line but sit on very different foundations. Imagine two companies, each earning ₹200 crore in operating profit. The first pays ₹16 crore a year in interest; the second pays ₹150 crore. Both are “profitable.” Both are “paying their interest.” But their coverage ratios — 12.5x versus 1.3x — describe two entirely different worlds.
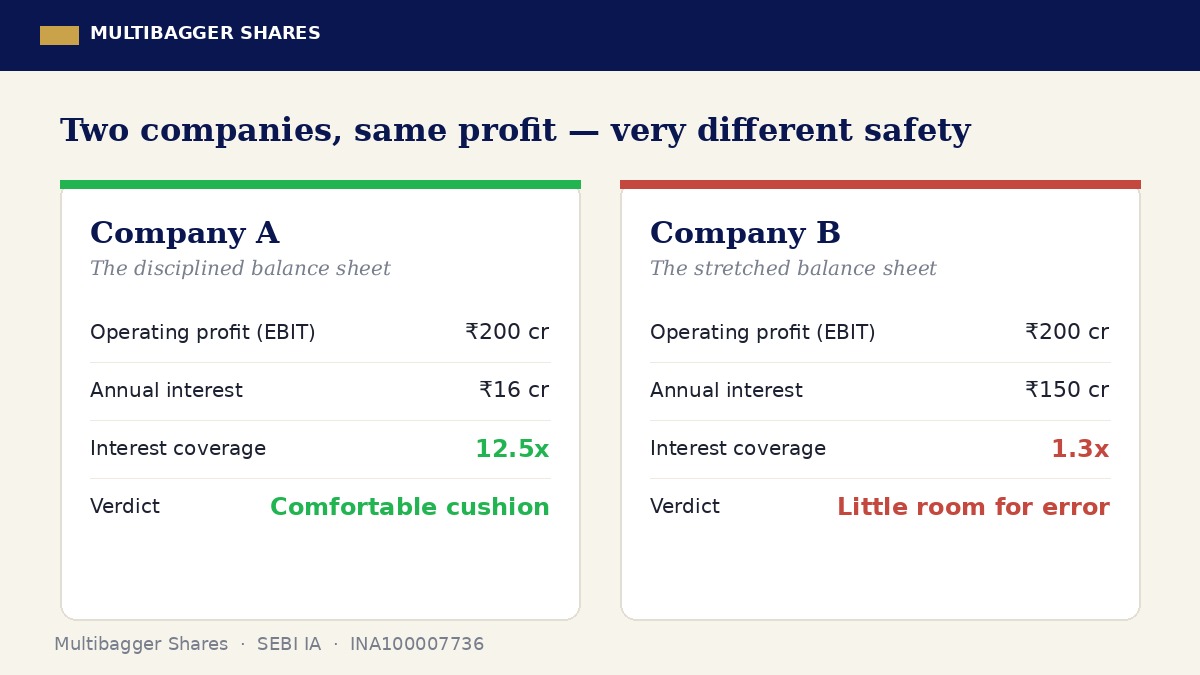
Company A could see its operating profit fall by more than 90% and still cover its interest. Company B would stop covering interest from operations after only a modest dip. If profits wobble, Company A negotiates from strength; Company B negotiates with its bankers. This is the entire point of the ratio: two businesses with the same headline profit can carry wildly different amounts of risk, and the interest coverage ratio is one of the fastest ways to see the difference.
Why one year is never enough
A single year’s coverage is a snapshot; the story is in the trend. A company whose coverage has climbed steadily — 3x, then 5x, then 8x — is usually deleveraging, growing profits, or both, and moving toward safety. A company whose coverage is sliding — 9x, then 6x, then 3x — deserves a much closer look, even if the latest number still seems adequate. The direction of travel matters as much as the level.
The table below shows the same illustrative company in a calm year and in a stress year. Notice how little has to go wrong. Revenue falls by less than a fifth, but because operating profit is geared, EBIT more than halves; meanwhile interest edges up as the company borrows a little more to get through. Coverage drops from a healthy 5.0x to a fragile 1.6x. Nothing dramatic happened in any single line — and yet the safety margin has almost entirely disappeared.
| Line item (₹ crore) | Calm year | Stress year |
|---|---|---|
| Revenue | 1,000 | 820 |
| Operating profit (EBIT) | 150 | 70 |
| Interest cost | 30 | 45 |
| Interest coverage (EBIT ÷ interest) | 5.0x | 1.6x |
Reading coverage across a full cycle — ideally five to ten years, spanning at least one bad patch for the industry — tells you far more than the latest figure. The question to ask is not merely “is coverage high today?” but “how low did coverage go the last time this business had a hard year?” That trough is the real test of a balance sheet.
The variations worth knowing
The basic EBIT-to-interest ratio has a few useful cousins, and knowing them keeps you from being misled. The first is EBITDA-based coverage, which adds back depreciation and amortisation. Because it uses a larger numerator, it always looks kinder than EBIT coverage. That is fine as long as you remember what it hides: depreciation is a real economic cost of wearing out plant and equipment, and a company that must keep spending heavily just to stand still cannot truly ignore it. For capital-heavy businesses, EBIT coverage is the more honest gauge.
The second is cash interest coverage, which compares cash flow from operations against interest actually paid in cash. This version is harder to dress up, because it draws on the cash-flow statement rather than the profit line, and cash is much more difficult to manufacture than reported profit. When a company’s profit-based coverage looks healthy but its cash-based coverage looks weak, that gap is worth investigating. Finally, some analysts prefer net interest coverage, which subtracts interest income earned on the company’s own cash and investments from the interest bill — sensible for a business sitting on a large treasury, less relevant for one that is not.
How an everyday investor can use this
You do not need a Bloomberg terminal to run this check. Every listed Indian company files its annual results with the exchanges, and the two numbers you need — operating profit and finance costs — are in the profit-and-loss statement, available free on the BSE and NSE websites and on most financial data portals. Popular Indian screening tools even calculate the ratio for you and let you filter for it.
A sensible way to use coverage is as a filter rather than a verdict. Before spending hours studying a company’s growth story, its products, or its management, it costs almost nothing to glance at interest coverage first. If a business you are considering shows coverage that has been thin and getting thinner, that is a reason to understand the debt properly before going further — not necessarily to walk away, but to know exactly what you are taking on. If coverage is thick and stable, you can move on to the parts of the analysis that decide whether the business is actually a good one. The ratio does not tell you whether a stock is cheap or dear; it tells you how much financial risk sits underneath, so you can weigh everything else with your eyes open.
This matters especially in India, where a great deal of retail attention flows toward smaller, faster-growing companies. Rapid growth often runs on borrowed money, and the businesses with the most exciting stories are sometimes the ones carrying the most leverage. Interest coverage is a quiet discipline that keeps a growth story honest: it asks whether the expansion can survive a bad year, not just whether it dazzles in a good one.
Common traps and misreadings
The ratio is simple, but it is easy to misuse. A few traps catch people repeatedly.
- Judging every industry by the same yardstick. A stable utility or a consumer-staples business with predictable cash flows can safely run at lower coverage than a cyclical commodity producer whose profits swing violently. Compare a company to its own history and to its direct peers, not to an abstract rule.
- Trusting a single good year. A cyclical company at the top of its cycle can show gorgeous coverage that evaporates when the cycle turns. Always find the worst year in the record.
- Ignoring off-balance-sheet and hidden obligations. Interest on borrowings is not always the whole picture. Lease commitments, guarantees, and other contractual obligations can act like debt without always sitting in the finance-cost line. Read the notes.
- Confusing “can pay interest” with “can repay debt.” Coverage measures the ability to service interest, not to repay the principal when it falls due. A company can cover its interest comfortably and still face a refinancing crunch if a large loan matures in a tight credit market. Look at the maturity profile too.
- Reading the ratio in isolation. Coverage is one gauge on the dashboard, alongside the debt-to-equity ratio, the cash balance, and the trend in operating cash flow. No single number should decide anything on its own.
Key takeaways
- Coverage measures breathing room. Interest coverage = operating profit (EBIT) ÷ interest. It tells you how many times over a company’s operations can pay its interest bill — the size of the cushion before debt becomes a problem.
- The trend beats the snapshot. Rising coverage usually signals a strengthening balance sheet; falling coverage is worth investigating even when the latest number still looks fine. Judge a company by how low its coverage fell in its worst year.
- Context decides the threshold. Above ~8x is a fortress, ~4x–8x is comfortable, ~2x–4x warrants watching, and below ~1.5x is a genuine danger zone — but always adjust for the industry and compare like with like.
- Use it as a filter, not a verdict. Coverage tells you how much financial risk sits under a business, not whether the stock is cheap or expensive. Check it early, then let the rest of your analysis do its work.
Debt turns a good business into a great one when it is affordable and into a fragile one when it is not. The interest coverage ratio is one of the plainest tools an everyday investor has for telling the two apart — and it takes about a minute to calculate.
— Manish Goel, for Multibagger Securities Research & Advisory Pvt. Ltd. — a SEBI Registered Investment Advisor (INA100007736)
SEBI Disclaimer: 9 out of 10 individual traders in the equity Futures & Options segment incurred net losses according to a SEBI study. F&O trading is essentially gambling. Focus on quality stock picking and long-term value investing instead. Multibagger Securities Research & Advisory Pvt. Ltd. is a SEBI Registered Investment Advisor (INA100007736). This content is for educational purposes only and is not a buy/sell recommendation on any stock. The companies and figures used in this article are illustrative examples for teaching purposes and do not refer to any specific listed company. Please do your own research or consult a qualified professional before investing.