Behavioral Finance

April 25, 2026
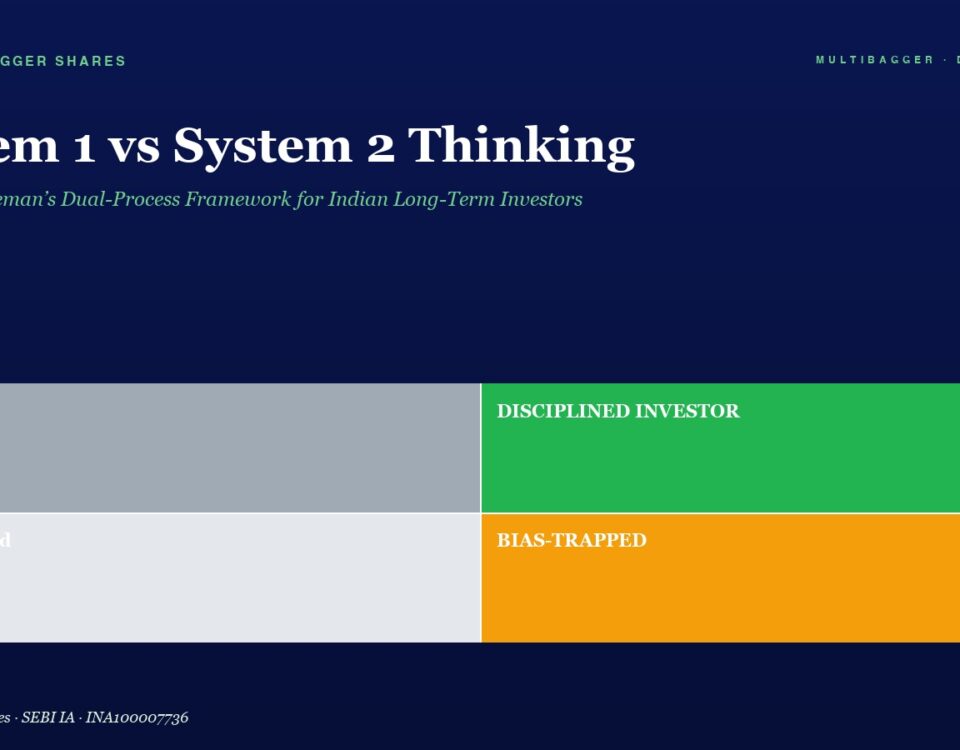
Hero image with the title 'System 1 vs System 2 Thinking' and a 2x2 color grid: top-left Lucky (gray), top-right Disciplined Investor (green), bottom-left Confused (light gray), bottom-right Bias-Trapped (orange) on a dark blue background.

System 1 vs System 2 Thinking: Daniel Kahneman’s Dual-Process Framework for Indian Long-Term Investors

Kahneman's dual-process theory unpacked for Indian retail investors: why System 1 hijacks portfolios, how Buffett, Munger, Klarman, and Marks engineer System 2, and how Titan Biotech's FY25 audited disclosures (₹3 Cr borrowings, 103% CFO/OP, 36.4% board independence) illustrate System-2-style management process.
April 25, 2026
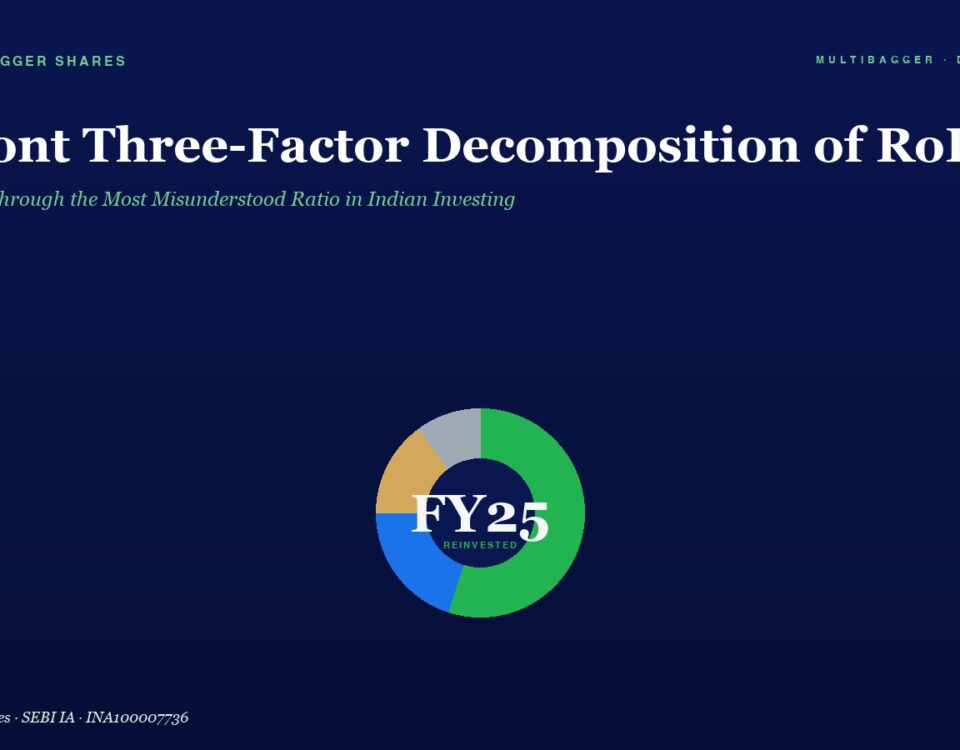
Site hero with a dark blue background, large white title 'DuPont Three-Factor Decomposition of RoE' and green subtitle, centered multicolor donut chart labeled FY25 Reinvented.

DuPont Three-Factor Decomposition of RoE: How to See Through the Most Misunderstood Ratio in Indian Investing

RoE without the DuPont decomposition is a meaningless headline. Two companies with identical 25% RoE can be a fortress compounder and a leveraged time bomb. Today's lesson teaches the framework using Titan Biotech FY25 audited numbers as a positive illustration.
April 24, 2026
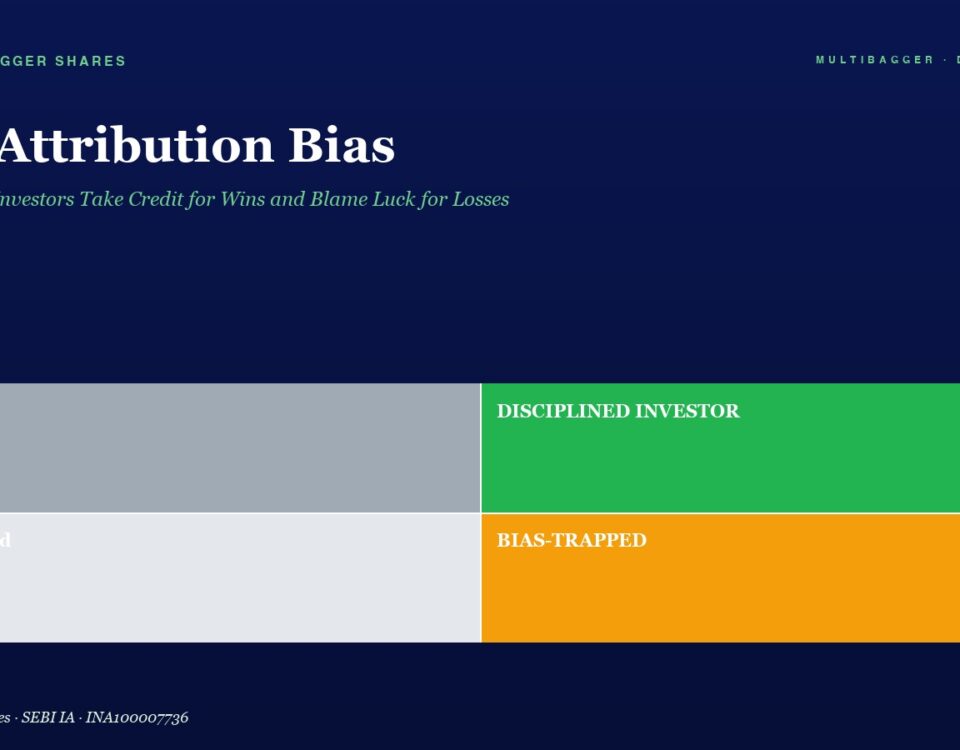
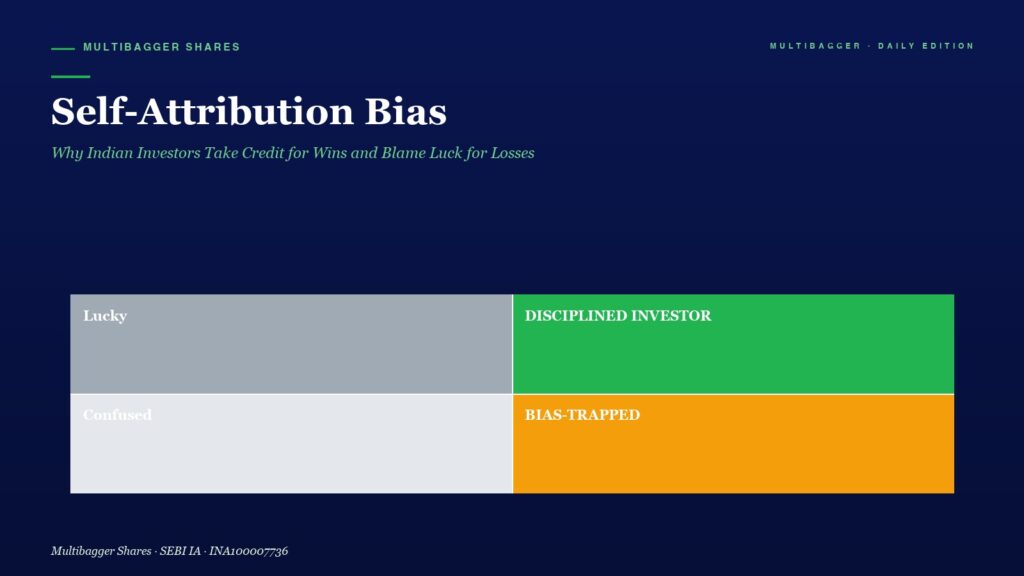
Dark blue article hero with title 'Self-Attribution Bias' and subtitle about Indian investors; below is a 2x2 color grid: top-left gray block labeled 'Lucky', top-right green block labeled 'DISCIPLINED INVESTOR', bottom-left light gray block labeled 'Confused', bottom-right orange block labeled 'BIAS-TAPPED' (likely 'BIAS-TRAPPED'). Branding 'Multibagger Shares' appears at top corners.

Self-Attribution Bias: Why Indian Investors Take Credit for Wins and Blame Luck for Losses

Self-attribution bias — crediting wins to skill and losses to bad luck — is the silent wealth destroyer behind 93% F&O retail losses in India. Miller & Ross (1975), Gervais & Odean (2001). Illustrative case on how Titan Biotech FY25 audited disclosures exhibit symmetric attribution at the corporate level.
April 24, 2026
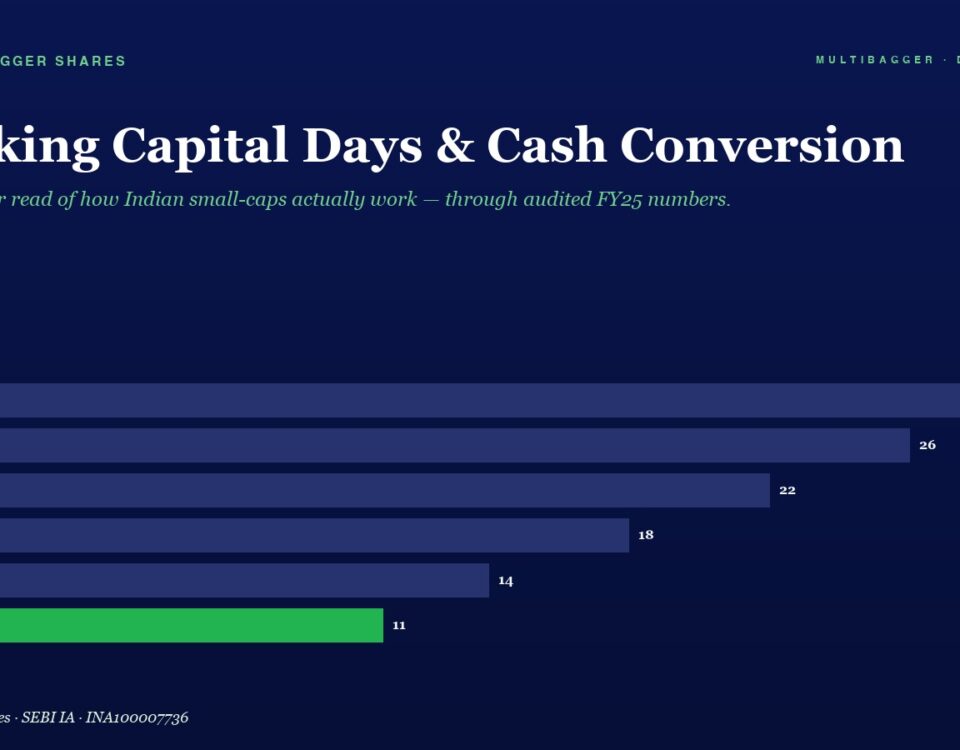
Horizontal bar chart of Working Capital Days & Cash Conversion by fiscal year from FY20 to FY25, with values FY20 28, FY21 26, FY22 22, FY23 18, FY24 14, FY25 11; FY25 bar is green.

Working Capital Days & Cash Conversion Cycle

Decode Cash Conversion Cycle and Working Capital Days the way serious value investors do — and see how Titan Biotech's 261-day FY25 CCC is fully self-funded with near-zero debt.
+91-8448836436