Indian Stocks

April 20, 2026
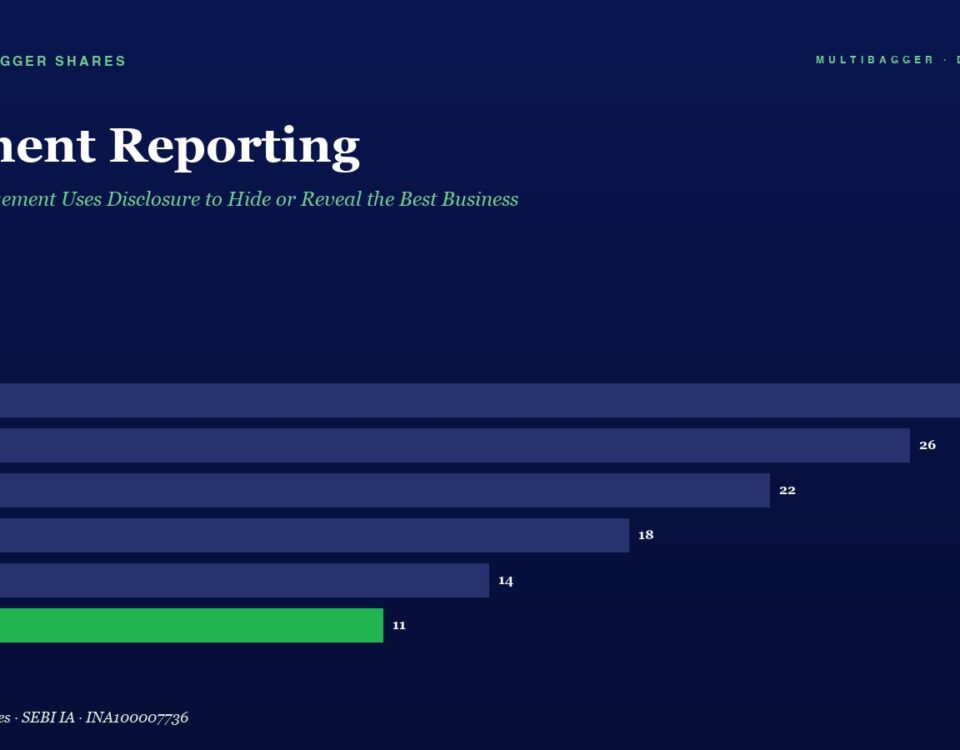
Horizontal bar chart titled Segment Reporting showing yearly values from FY20 to FY25; FY25 bar is green with value 11, trend downward from 28 to 11.

Segment Reporting: When Management Uses Disclosure to Hide or Reveal the Best Business

Why serious investors should read segment notes to discover where the real business quality sits, and how Titan’s geographic split strengthens trust in the disclosure.
April 17, 2026
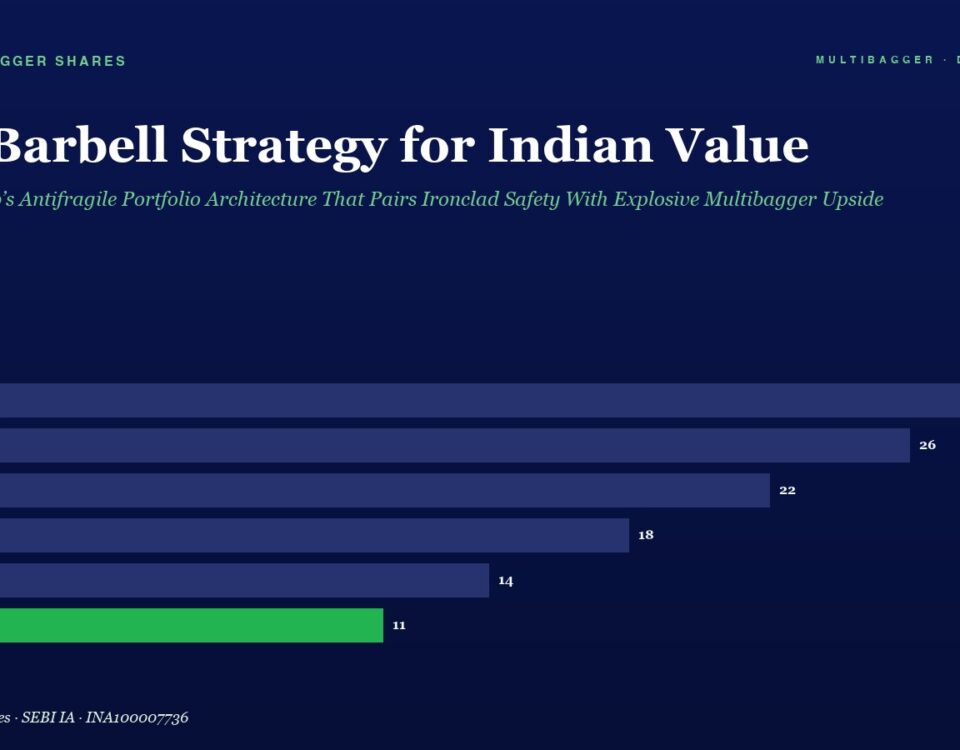
Hero image with the title 'The Barbell Strategy for Indian Value' and a horizontal bar chart of yearly values FY20–FY25; the FY25 bar is green with value 11.

The Barbell Strategy for Indian Value Investors: Nassim Taleb’s Antifragile Portfolio Architecture That Pairs Ironclad Safety With Explosive Multibagger Upside

Nassim Taleb's barbell strategy teaches Indian value investors to combine 80-90% ultra-safe assets with 10-20% high-upside quality small-caps for a truly antifragile portfolio.
April 15, 2026
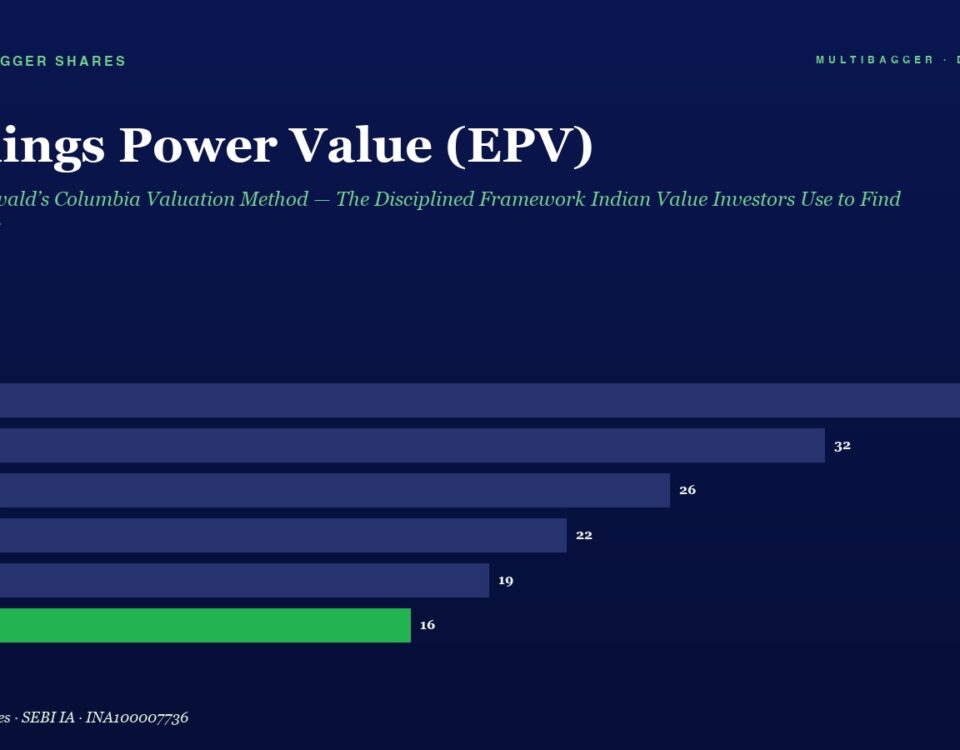
Earnings Power Value (EPV) bar chart on a dark blue background, showing FY20 38, FY21 32, FY22 26, FY23 22, FY24 19, and FY25 16; the FY25 bar is green.

Earnings Power Value (EPV): Bruce Greenwald’s Columbia Valuation Method — The Disciplined Framework Indian Value Investors Use to Find Multibaggers Without Forecasting the Future

📅 Published April 15, 2026 (Wednesday) Why Most Indian Value Investors Are Using the Wrong Valuation Method Ask ten Indian value investors how they calculate the […]
+91-8448836436