stock valuation

April 12, 2026
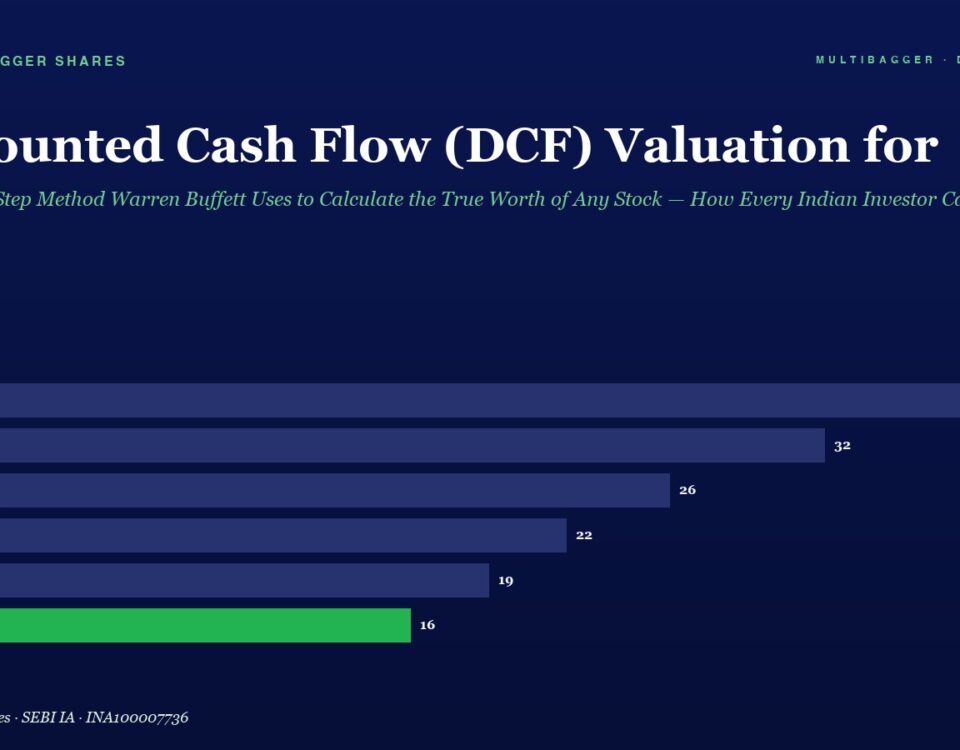
Bar chart of annual DCF valuation from FY20 to FY25, with FY25 shown in green; values are 38, 32, 26, 22, 19, 16.

Discounted Cash Flow (DCF) Valuation for Beginners: The Step-by-Step Method Warren Buffett Uses to Calculate the True Worth of Any Stock — How Every Indian Investor Can Master This Timeless Valuation Tool to Find Undervalued Multibaggers in 2026

📅 Published April 12, 2026 (Saturday) Why Every Serious Investor Must Learn DCF — The Language of Intrinsic Value When Warren Buffett evaluates a stock, he […]
April 7, 2026
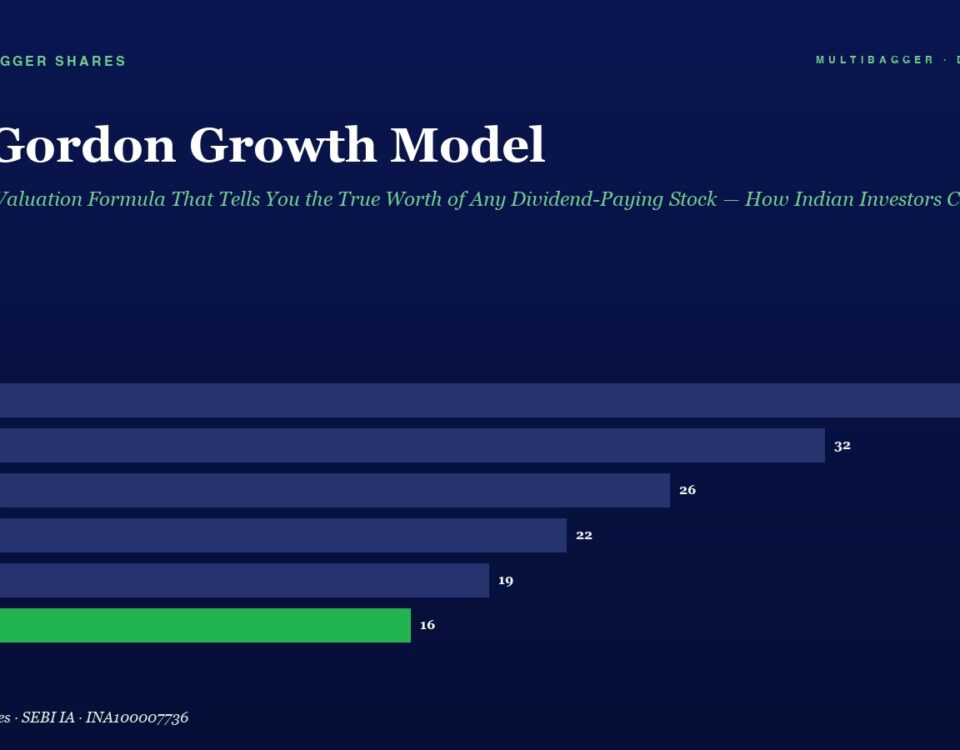
Bar chart illustrating Gordon Growth Model projections by fiscal year FY20–FY25; values 38, 32, 26, 22, 19, and 16 (green bar for FY25).

The Gordon Growth Model: The Elegant Valuation Formula That Tells You the True Worth of Any Dividend-Paying Stock — How Indian Investors Can Use This Timeless Method to Find Undervalued Compounders Before the Market Catches On

📅 Published April 07, 2026 (Tuesday) Why Most Indian Investors Get Valuation Completely Wrong Here is a question that separates serious investors from speculators: if a […]
April 3, 2026
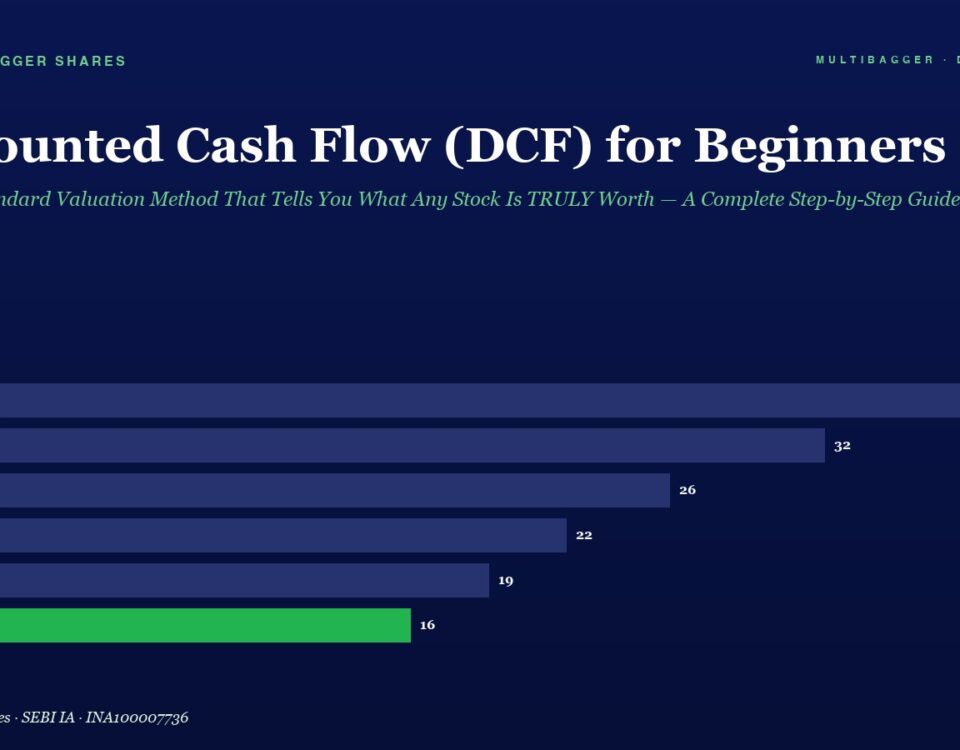
Bar chart of discounted cash flow (DCF) by fiscal year from FY20 to FY25, showing a decline from 38 to 16 (FY25 in green).

Discounted Cash Flow (DCF) for Beginners: The Gold Standard Valuation Method That Tells You What Any Stock Is TRULY Worth — A Complete Step-by-Step Guide for Indian Investors

📅 Published April 02, 2026 (Wednesday) Why Every Indian Investor Needs to Understand DCF — The Only Valuation Method That Answers “What Is This Stock Really […]
March 27, 2026
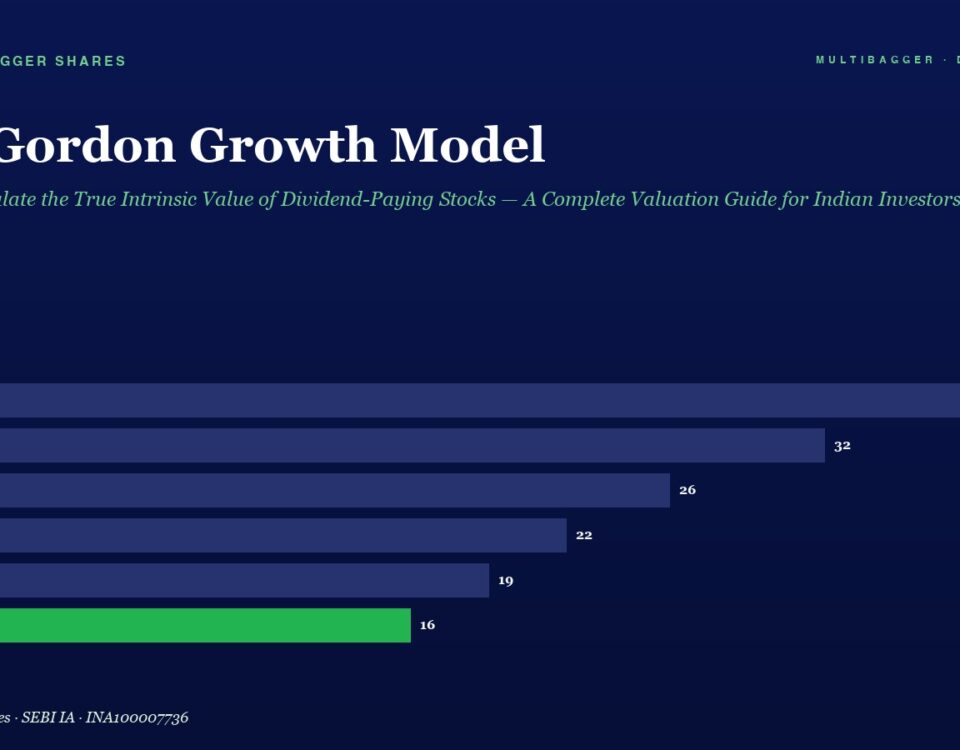
Title and subtitle of a data chart: bar chart showing yearly values FY20–FY25 with a green bar for FY25; values 38, 32, 26, 22, 19, 16.

The Gordon Growth Model: How to Calculate the True Intrinsic Value of Dividend-Paying Stocks — A Complete Valuation Guide for Indian Investors

📅 Published March 27, 2026 (Friday) What Is the Gordon Growth Model? In 1956, Professor Myron J. Gordon and economist Eli Shapiro published one of the […]
+91-8448836436