April 23, 2026
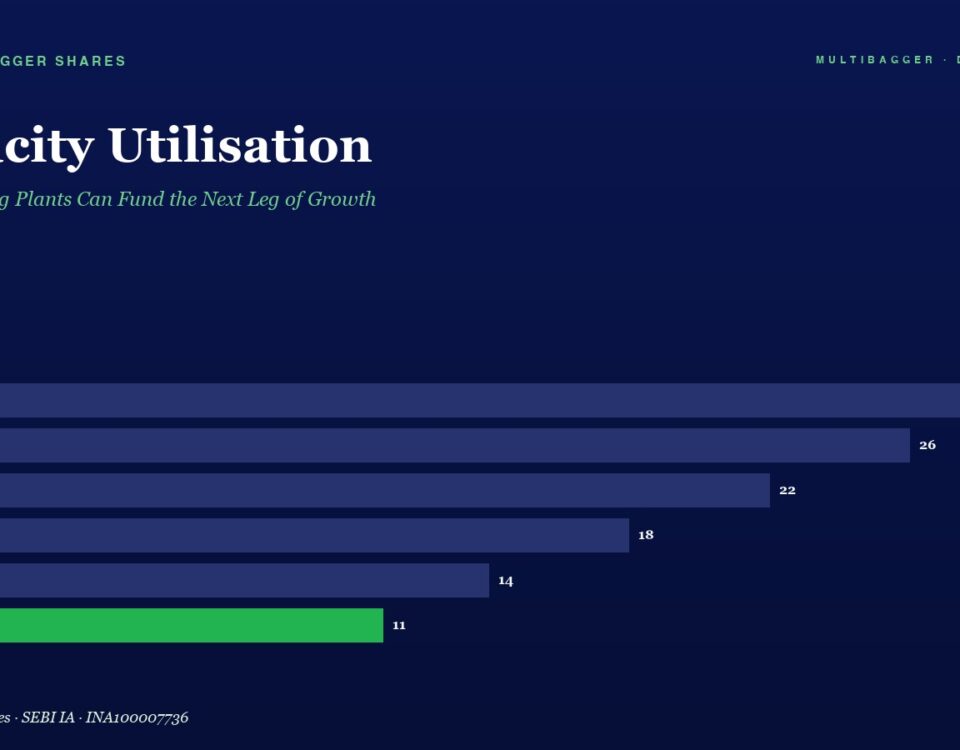
Hero section with a dark navy background showing a capacity utilisation bar chart from FY20 to FY25, ending at 11% for FY25 (green bar). The page title is ‘Capacity Utilisation’ with a subtitle about growth.

Capacity Utilisation: When Existing Plants Can Fund the Next Leg of Growth

Capacity Utilisation becomes more useful when investors translate it into audited numbers, cleaner disclosure, and better minority-shareholder readability.
April 22, 2026
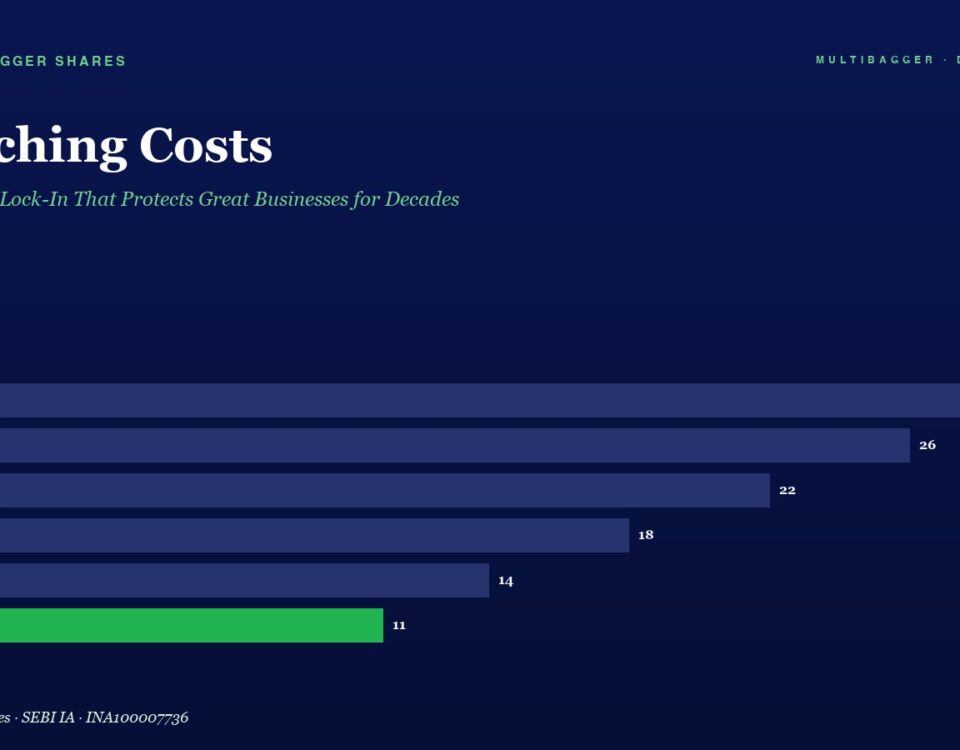
Infographic titled Switching Costs: horizontal bar chart of yearly costs FY20–FY25; values 28, 26, 22, 18, 14, 11, with FY25 bar in green.

Switching Costs: The Invisible Lock-In That Protects Great Businesses for Decades

Switching Costs becomes more useful when investors translate it into audited numbers, cleaner disclosure, and better minority-shareholder readability.
+91-8448836436