Behavioral Finance
May 16, 2026
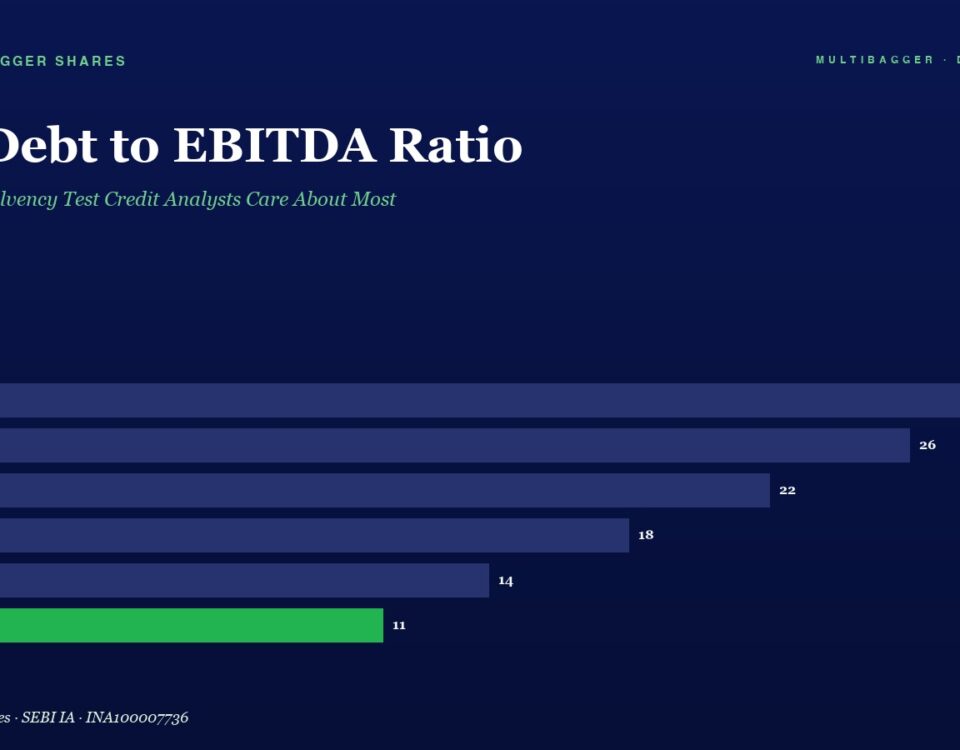
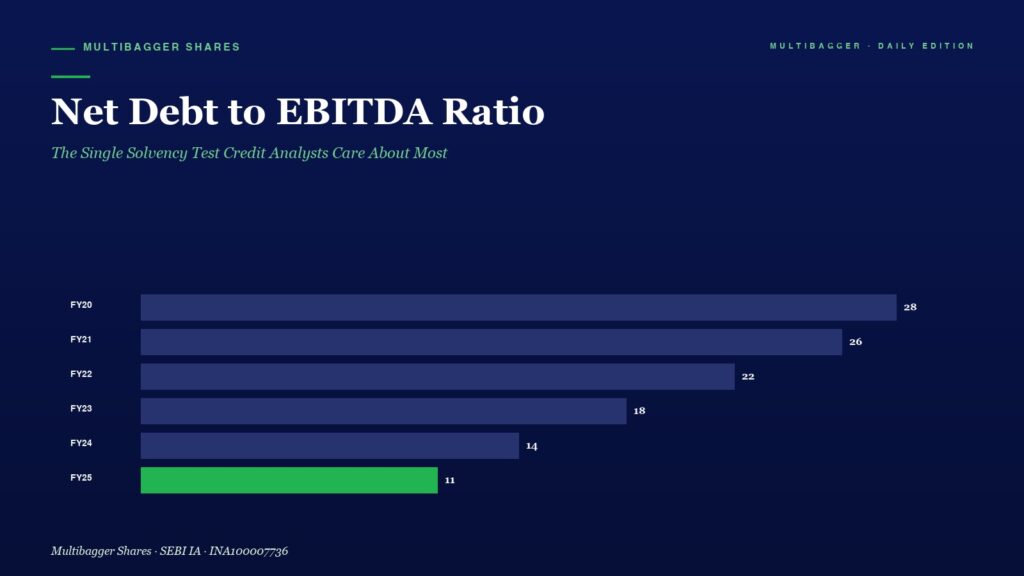
Net Debt to EBITDA is the single ratio professional credit analysts use most when assessing survival odds. This educational deep-dive teaches how to read it, where retail investors misinterpret it, and how Titan Biotech (BSE: 524717) FY25 audited numbers illustrate a -0.75x net-cash fortress reading. Not a buy/sell recommendation.
May 16, 2026
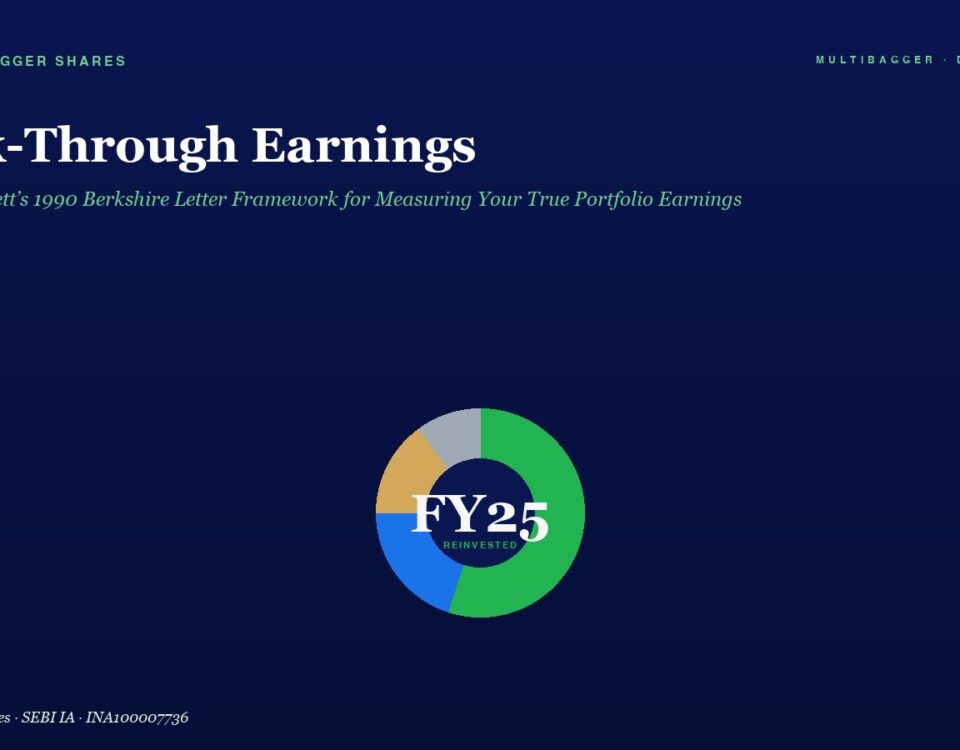
Warren Buffett's 1990 Berkshire letter introduced look-through earnings — dividends plus your proportional share of retained profits. Why this single number reveals what your portfolio truly earned, illustrated by Titan Biotech FY25's high-retention, low-debt capex discipline.
May 15, 2026
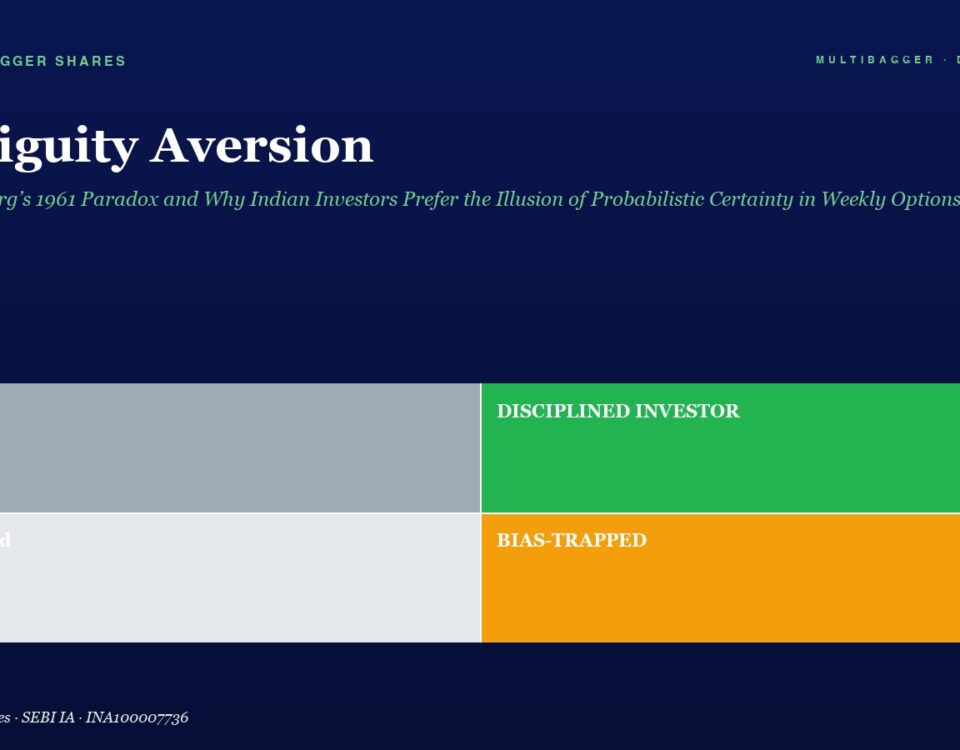
Daniel Ellsberg's 1961 paradox shows humans pay a premium to avoid unknown probabilities, not just risk. This explains the bulk of Indian F&O loss data, sub-5-month equity holding periods and month-21 SIP abandonment. Titan Biotech FY25's disclosure architecture is read as a positive illustration of how a small-cap can collapse ambiguity for long-term investors. Educational case study only — no buy/sell call.
May 15, 2026
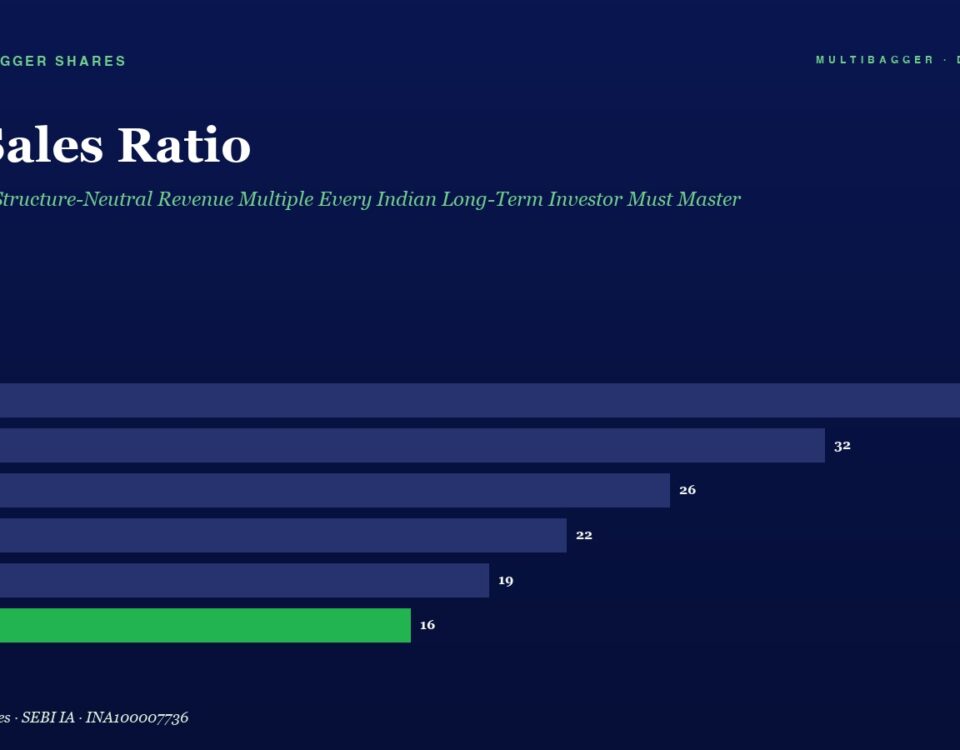
EV/Sales is the capital-structure-neutral valuation lens that puts equity and debt holders on the same footing. Learn how to read the multiple correctly — using Titan Biotech's FY25 audited ₹214 Cr revenue, ₹3 Cr borrowings, and 103% CFO/OP cash conversion as an educational illustration of management discipline.