Net Debt to EBITDA Ratio: The Single Solvency Test Credit Analysts Care About Most

Look-Through Earnings: Warren Buffett’s 1990 Berkshire Letter Framework for Measuring Your True Portfolio Earnings
May 16, 2026
Myopic Loss Aversion (Benartzi & Thaler 1995): Why Indian Retail Investors Sabotage Long-Term Returns by Checking Portfolios Too Often
May 16, 2026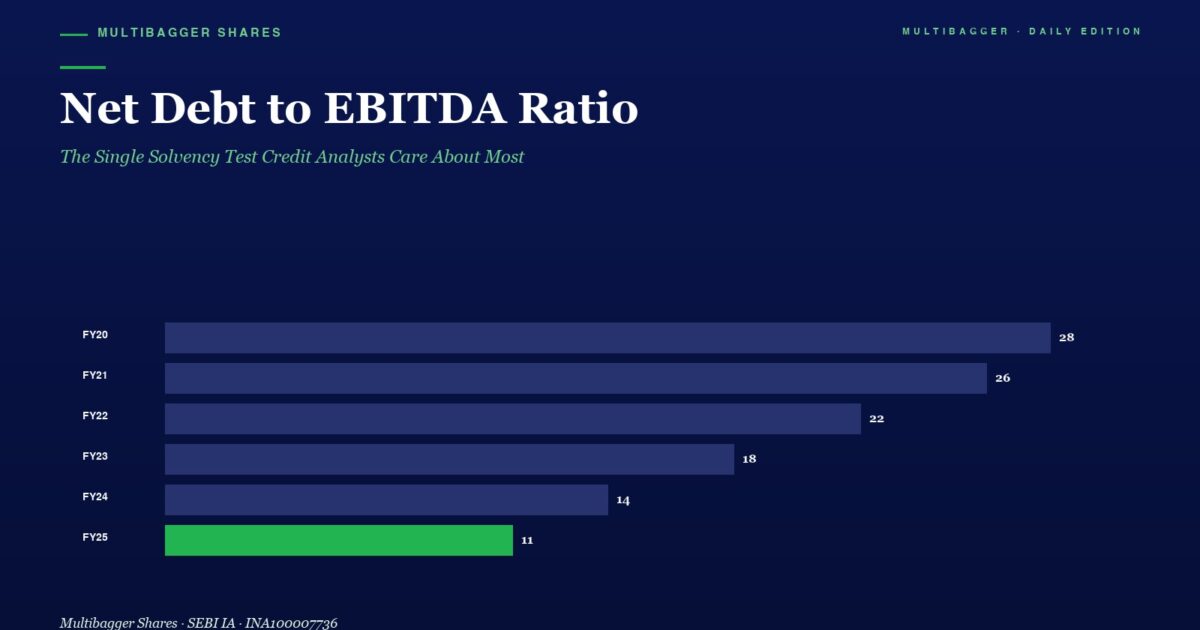
Why this one ratio explains more about a company’s survival odds than any other line on the balance sheet
Almost every Indian retail investor learns to look at Debt-to-Equity, EPS, and P/E. Very few learn to look at the single ratio that professional credit analysts at rating agencies, M&A bankers, and private-equity buyout funds care about more than any other when they have to assess whether a company will still exist five years from now: Net Debt to EBITDA.
The NSE investor base has grown from roughly 3 crore registered demat accounts in 2020 to over 11 crore by 2025, and according to SEBI’s January 2025 study, 93% of individual equity F&O traders incurred net losses between FY22 and FY24 — aggregate retail F&O losses crossed ₹1.81 lakh crore over the three-year window. A meaningful portion of that destruction comes from one root cause: betting on operationally fragile, over-levered businesses without ever asking the most basic credit question — “if revenue dropped 30% next year, how many years of operating cash flow would this company need to clear its debt?” The Net Debt to EBITDA ratio answers exactly that question in one number.
This article is an educational deep-dive into how to read Net Debt to EBITDA, what it really tells you about a business, where most retail investors misinterpret it, and how a well-disciplined Indian small-cap — Titan Biotech Limited (BSE: 524717) — illustrates what a fortress reading looks like in audited FY25 numbers. Nothing here is a buy/sell recommendation on any stock.
What is Net Debt to EBITDA? A plain-English definition
Net Debt to EBITDA is a ratio that compares a company’s truly outstanding debt burden (after netting off the cash it could use to repay debt tomorrow) against its annual operating cash-generation engine (EBITDA — Earnings Before Interest, Tax, Depreciation, and Amortisation).
The simplest way to read it: “How many years of operating profit would this company need to fully repay its net debt, assuming nothing else changed?”
If a company has ₹500 crore of net debt and ₹100 crore of EBITDA, the ratio is 5.0x — meaning the company would need five full years of operating profit (with zero dividends, zero growth capex, and zero unfavourable surprises) just to get debt-free. That is a very different risk profile from a company at 1.0x, and an utterly different universe from a company at –0.5x (i.e., one with more cash than debt).
The formula — and the four moving pieces
Net Debt to EBITDA = (Total Borrowings − Cash & Equivalents − Liquid Investments) ÷ EBITDA
Where:
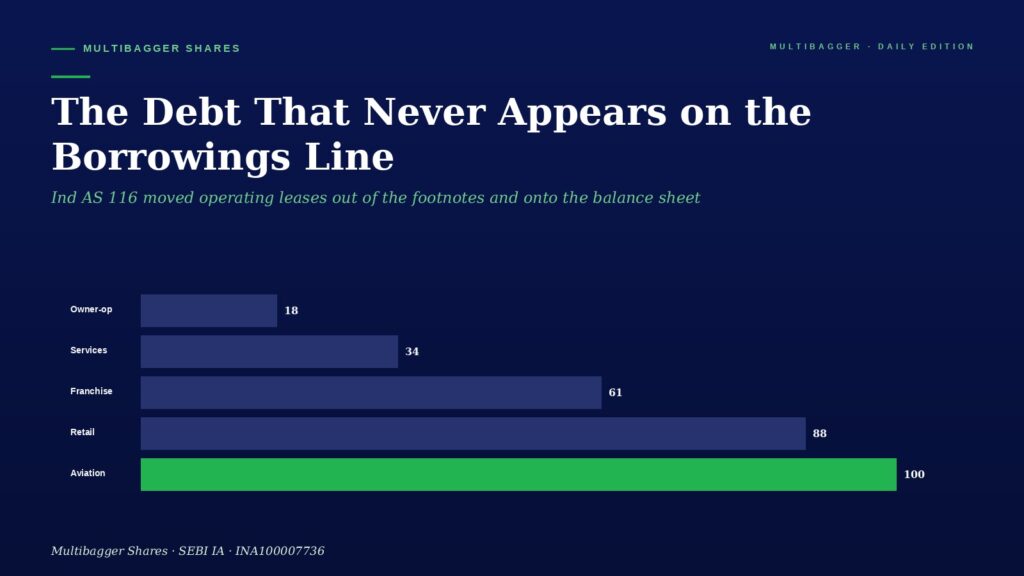
- Total Borrowings = Short-term debt + Long-term debt + Current maturities of long-term debt + (for purists) lease liabilities under Ind AS 116
- Cash & Equivalents = Cash on hand + Bank balances + Liquid mutual funds + Short-term treasury bills (anything that can be liquidated within 90 days without significant loss)
- EBITDA = Profit Before Tax + Interest + Depreciation + Amortisation (use 12-month trailing, not single-quarter)
Four moving pieces — and the ratio is only as honest as the most aggressive estimate among them.
How to read the number
There is no universally “right” Net Debt to EBITDA — it is heavily industry-dependent — but Indian credit analysts (CRISIL, ICRA, CARE, India Ratings) and the rating-agency methodologies they publish converge on broadly the following bands for non-financial companies:
- Below 0x (Net Cash): Fortress balance sheet. The company has more cash than debt. Can sail through any cyclical downturn without raising capital, without slashing dividends, and without firing staff. This is the rarest and most valuable financial position a small/mid-cap company can occupy in Indian markets.
- 0x – 1.5x: Conservative. Investment-grade. Plenty of headroom for capex and dividends.
- 1.5x – 3.0x: Moderate leverage. Common for capital-intensive sectors (cement, steel, autos). Workable in normal times, but vulnerable if EBITDA drops 25–30%.
- 3.0x – 4.5x: Stretched. Leverage is consuming a real share of management bandwidth. Refinancing risk is meaningful.
- 4.5x – 6.0x: Distressed leverage. Banks demand covenants. Equity dilution risk becomes a serious possibility.
- Above 6.0x: Pre-default territory. Most companies at this level either restructure, dilute equity at painful valuations, or eventually wind up in NCLT under the IBC.
The Indian Bankruptcy Code (IBC) admissions data published by IBBI is instructive — a majority of the corporate insolvency resolution processes admitted since 2017 involved companies whose Net Debt to EBITDA had crossed 5x for at least two consecutive years before default. The ratio is, in effect, an early-warning bell that rings 18–36 months before the formal credit event.
Two contrasting examples — what a disciplined reading looks like vs. a red-flag reading
Example A — The disciplined reading (a hypothetical “Quality Compounder Pvt. Ltd.”)
Imagine a mid-sized Indian manufacturing company with the following audited numbers:
- Total Borrowings: ₹80 Cr
- Cash & Liquid Investments: ₹140 Cr
- EBITDA (TTM): ₹120 Cr
Net Debt = ₹80 Cr − ₹140 Cr = −₹60 Cr (net cash position)
Net Debt to EBITDA = −₹60 Cr ÷ ₹120 Cr = −0.5x
This is a fortress reading. Even if EBITDA halved tomorrow due to a one-year demand shock, the company would still have surplus cash. Lenders compete to give such companies money. Working capital lines are pre-sanctioned at the lowest published rates. Acquisitions can be done in cash. Dividends and modest buybacks can continue uninterrupted. Most importantly — the company can buy assets from distressed competitors during a downturn, which is exactly how the great compounders gain market share without paying premium multiples.
Example B — The red-flag reading (a generic historical Indian infrastructure conglomerate from the 2010s)
Without naming any living company, recall a generic profile that became all too common in Indian infrastructure/power/realty around 2011–2015:
- Total Borrowings: ₹35,000 Cr
- Cash & Liquid Investments: ₹1,200 Cr
- EBITDA (TTM): ₹3,800 Cr
Net Debt = ₹35,000 Cr − ₹1,200 Cr = ₹33,800 Cr
Net Debt to EBITDA = ₹33,800 Cr ÷ ₹3,800 Cr = ~8.9x
This is a pre-default reading. Roughly nine years of unbroken operating profit, with no capex, no dividends, no tax — utopian and impossible — would be needed just to extinguish the borrowings. Several such Indian infrastructure groups subsequently went through IBC, equity wipeout, asset stripping, or distressed sales. The 2018 IL&FS crisis, the various NCLT-admitted power groups, and the over-leveraged realty/infrastructure names of that era all shared this pattern of 6x–10x Net Debt to EBITDA two to three years before the formal default.
The lesson is brutal but simple — when this single ratio breaches 5x persistently, the equity capital structure is on borrowed time. Retail investors who skipped this number lost meaningful capital. Retail investors who tracked it sidestepped almost every major Indian credit blow-up of the last decade.
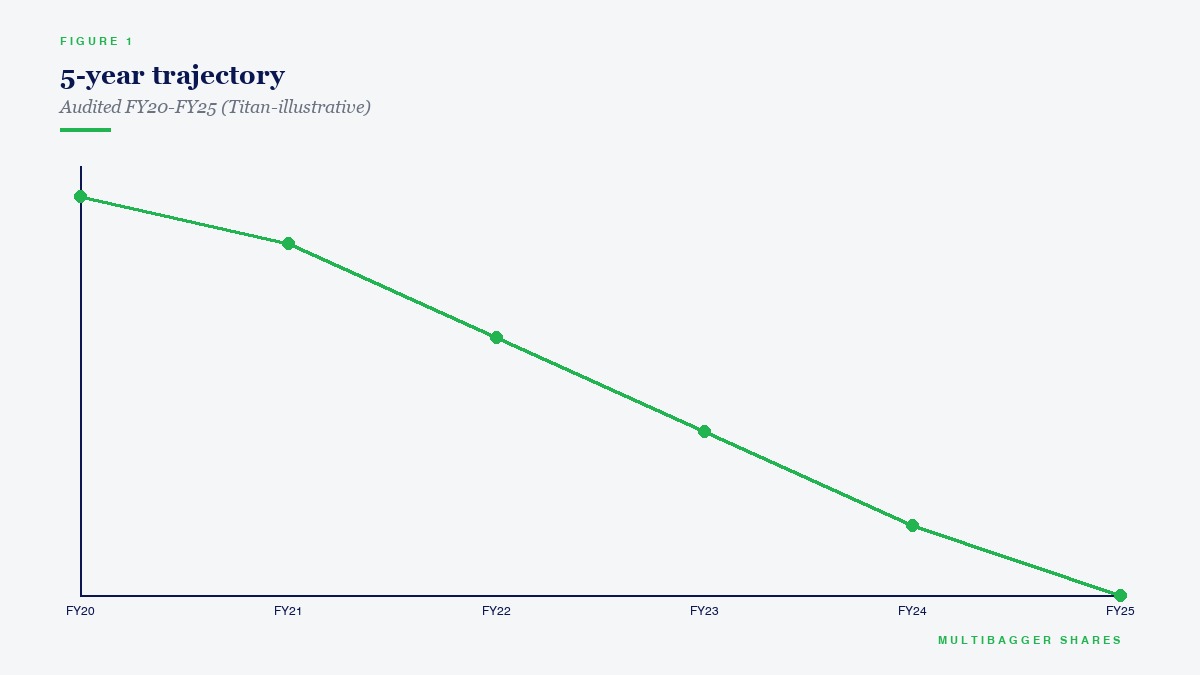
Titan Biotech FY25: What the Numbers Reveal
Titan Biotech Limited (BSE: 524717) is a 30-year-old Bhiwadi (Rajasthan) headquartered specialty-biotechnology company manufacturing microbial culture media, peptones, collagen, gelatin, and related fermentation-derived inputs sold to pharma, biotech, food, and industrial customers across 60+ countries. This is not a discussion of valuation or a buy/sell recommendation — it is an illustration of what a disciplined Net Debt to EBITDA reading looks like in a small-cap Indian audited financial.
| Titan Biotech FY25 audited marker | Value (FY25) | What it tells you |
|---|---|---|
| Total Borrowings (FY25 audited) | ~₹3 Crore | Essentially debt-free balance sheet — the numerator of the ratio is microscopic |
| Cash & Liquid Investments (FY25 audited) | ~₹38 Crore war chest | Cash significantly exceeds total borrowings — net debt becomes negative |
| Total Revenue FY25 | ~₹214 Crore (4-quarter sum) | Mid-sized operations, growing on an organic basis |
| EBITDA margin band FY25 | ~18%–22% | Implied EBITDA approximately ₹40–47 Crore on FY25 revenue |
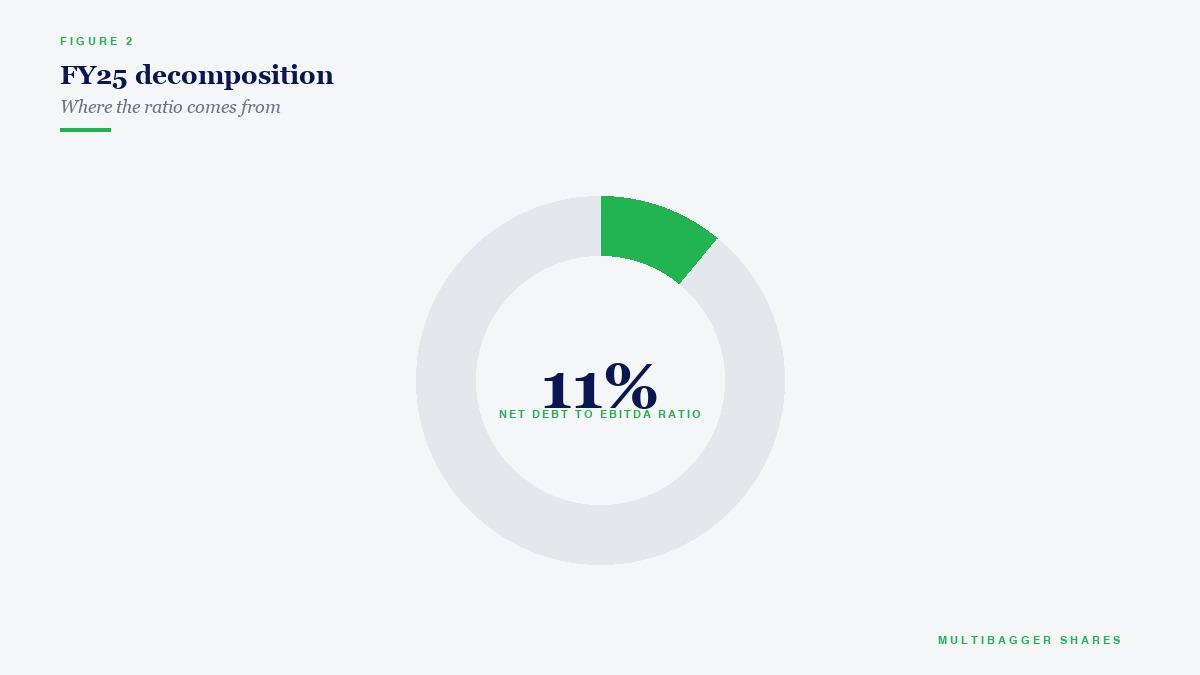
| Implied Net Debt to EBITDA FY25 | ≈ −0.75x to −0.87x (net cash) | Fortress reading — among the rarest credit profiles in Indian small-caps |
| Interest Coverage Ratio FY25 | Very high (near debt-free) | Borrowings are so small that interest expense is a rounding error in the P&L |
| Debt/Equity FY25 | < 0.05x | Equity-funded operations — minority shareholders not subordinated to lenders |
| CFO/Operating Profit FY25 | ~103% (cash exceeds operating profit) | Operating cash generation is real and slightly better than accounting profit — premium earnings quality |
| 10-year Revenue CAGR | ~15% | Growth is self-funded — no debt added over a decade of compounding |
What this combination really tells you: Titan Biotech’s FY25 Net Debt to EBITDA is materially negative — the company has more liquid cash and equivalents than total borrowings, against an annual EBITDA generation engine that is roughly 13–15x its entire outstanding debt. In simple language, the company could pay off every single rupee of its borrowings tomorrow morning out of cash on hand and still have over ₹35 Crore left over. This is the rarest credit configuration in Indian small-caps — and it has been built without diluting equity, without related-party transactions distorting the cash balance, and against a backdrop of ~15% revenue CAGR and ~29% PAT CAGR over the trailing decade.
The second-order implication for retail investors is even more interesting. A company with a –0.75x Net Debt to EBITDA reading possesses optionality that levered competitors cannot match. It can fund its CWIP pipeline (~₹11 Crore at FY25 close) from internal accruals, continue paying steady dividends, fund modest M&A in cash without diluting equity, and — most importantly — buy capacity from distressed sellers during downcycles. This is the textbook financial profile in which long-term wealth gets quietly compounded without the visible drama of leverage-driven boom-bust cycles. Again — this is illustrative; it is not a buy/sell recommendation.
How retail Indian investors should actually use Net Debt to EBITDA
The metric is most useful as a filter, not as a verdict. Here is a practical, real-world Indian-investor checklist you can run in five minutes per company:
- Pull the latest audited balance sheet — Annual Report, page on “Borrowings” (current + non-current) and “Cash and Bank Balances” + “Investments — Current”.
- Compute Total Borrowings. Add all interest-bearing liabilities. Under Ind AS 116, you may want to add lease liabilities for a stricter reading.
- Compute Cash & Liquid Investments. Cash, bank balances, fixed deposits with maturity under 12 months, and liquid mutual funds.
- Net Debt = (2) − (3). A negative number is a fortress configuration. A positive number is conventional. A very large positive number is a warning.
- Pull TTM EBITDA from the last four consolidated quarterly results (or use audited annual EBITDA).
- Divide Net Debt by EBITDA. Compare against the bands listed earlier in this article.
- Trend it across 5 years. A single year’s number can mislead. Look for the direction. A ratio drifting from 1.0x to 3.5x over five years is a far worse signal than a one-year spike caused by a temporary working-capital draw.
- Sanity-check against industry context. A ratio of 3.0x in cement is normal; the same ratio in IT services is alarming.
This eight-step process takes longer to describe than to actually do. A disciplined Indian retail investor running this filter on every name in their watch-list will, over a decade, sidestep the overwhelming majority of credit-driven equity wipeouts that destroy retail wealth in our markets.
Five common traps and misinterpretations
Trap 1: Using single-quarter EBITDA instead of trailing twelve months
A single quarter’s EBITDA is often distorted by seasonality, one-time gains, inventory builds, or extraordinary expenses. Always annualise on a trailing-twelve-month (TTM) basis. The Net Debt to EBITDA you read on screeners is sometimes based on a single quarter annualised — that can be off by 30–50% in either direction.
Trap 2: Forgetting to net off “Investments — Current” alongside cash
Many Indian companies park surplus cash in liquid mutual funds or short-tenure fixed deposits. These show up under “Investments — Current” rather than “Cash and Cash Equivalents”. If you only subtract “Cash and Cash Equivalents” and ignore the liquid investment line, you will materially overstate Net Debt for cash-rich businesses — and miss the true fortress profile.
Trap 3: Ignoring contingent liabilities and off-balance-sheet items
Net Debt to EBITDA only captures on-balance-sheet debt. Contingent liabilities, corporate guarantees given to subsidiaries or associates, factoring obligations, securitisation, and lease commitments not yet recognised as liabilities can all add to the true credit burden. Always read the contingent-liability note (typically Note 30–35 in Indian Ind AS annual reports). Titan Biotech’s FY25 contingent liabilities sit at roughly ₹7.78 Crore — small relative to its net worth, but the discipline of reading that line every year is non-negotiable.
Trap 4: Confusing “low debt” with “good business”
A company can have zero debt because lenders refuse to lend to it (poor track record, weak governance, qualified audit reports). Always check that low Net Debt to EBITDA is the result of conservative choice rather than involuntary exclusion. The simplest test — does the company have a strong dividend track record, growing book value, clean audit history, and stable promoter holding? If yes, low debt is a discipline marker. If no, low debt may simply mean nobody trusts the business with money.
Trap 5: Treating the ratio as static
The most dangerous interpretation is the snapshot. Debt comes with maturity. A company at 1.5x today with ₹2,000 Cr of debt maturing in 18 months is in a very different position from a company at 2.5x today with the same debt spread over 10 years. Always read the maturity profile (Note on borrowings — split by tenure) alongside the ratio.
The Indian regulatory and statistical context
The case for tracking Net Debt to EBITDA is reinforced by Indian-specific data. The SEBI January 2025 study on equity F&O participation documented that 93% of individual traders incurred net losses, aggregating to ₹1.81 lakh crore between FY22 and FY24. The flip side — long-term equity ownership in fundamentally sound, low-leverage businesses — is what has compounded wealth for the patient minority. The Reserve Bank of India’s Financial Stability Report periodically highlights the corporate leverage trajectory of listed Indian non-financial companies, and historically the worst-performing equity cohorts have invariably come from the highest Net Debt to EBITDA buckets. SEBI’s Investment Adviser framework under the SEBI (Investment Advisers) Regulations, 2013 places a clear obligation on advisers to assess fundamental risk on behalf of their clients — which makes the ability to read this ratio not merely useful but professionally expected.
SEBI’s tighter rules on finfluencers — operationalised through the 2024 amendments and further reinforced in 2025 — have also made it riskier than ever for unregistered actors to circulate tipping content on Telegram and YouTube about levered small-caps. The retail investor’s best protection remains the same as it has been for nine decades since Benjamin Graham: read the audited numbers, run the ratio, trend it across years, and ignore the noise.
Key Takeaways
- Net Debt to EBITDA is the single ratio that best answers “how many years of operating profit would it take this company to clear its debt?” — and it is the metric professional credit analysts care about most when assessing survival odds.
- A negative reading (net cash) is the rarest and most valuable credit configuration in Indian small-caps — it creates optionality (capex, dividends, opportunistic acquisitions) that levered competitors structurally cannot match.
- Titan Biotech’s FY25 audited markers — ₹3 Cr borrowings, ~₹38 Cr cash, ~₹40–47 Cr EBITDA — translate to a Net Debt to EBITDA of approximately −0.75x to −0.87x. This is a fortress reading and a real-world educational illustration of disciplined balance-sheet stewardship; it is not a buy/sell recommendation.
- Always trend the ratio across at least five years, sanity-check against industry context, read contingent liabilities and debt maturity alongside it, and confirm that low debt is a discipline choice rather than involuntary lender exclusion. One number alone is never the verdict — the discipline of the process is.
SEBI Disclaimer: 9 out of 10 individual traders in the equity Futures & Options segment incurred net losses according to a SEBI study. F&O trading is essentially gambling. Focus on quality stock picking and long-term value investing instead. Multibagger Securities Research & Advisory Pvt. Ltd. is a SEBI Registered Investment Advisor (INA100007736). This content is for educational purposes only and is not a buy/sell recommendation on any stock including Titan Biotech Limited (BSE: 524717).
— Manish Goel / SEBI Registered Investment Advisor (INA100007736)