More Packets, or a Bigger Price Tag? How to Read a Company’s Sales Growth

The Customer Who Makes the Rules: What Changes When a Company’s Main Buyer Is the Government
August 26, 2026
When a Rival Starts Giving It Away: What a Price War Really Tests
August 29, 2026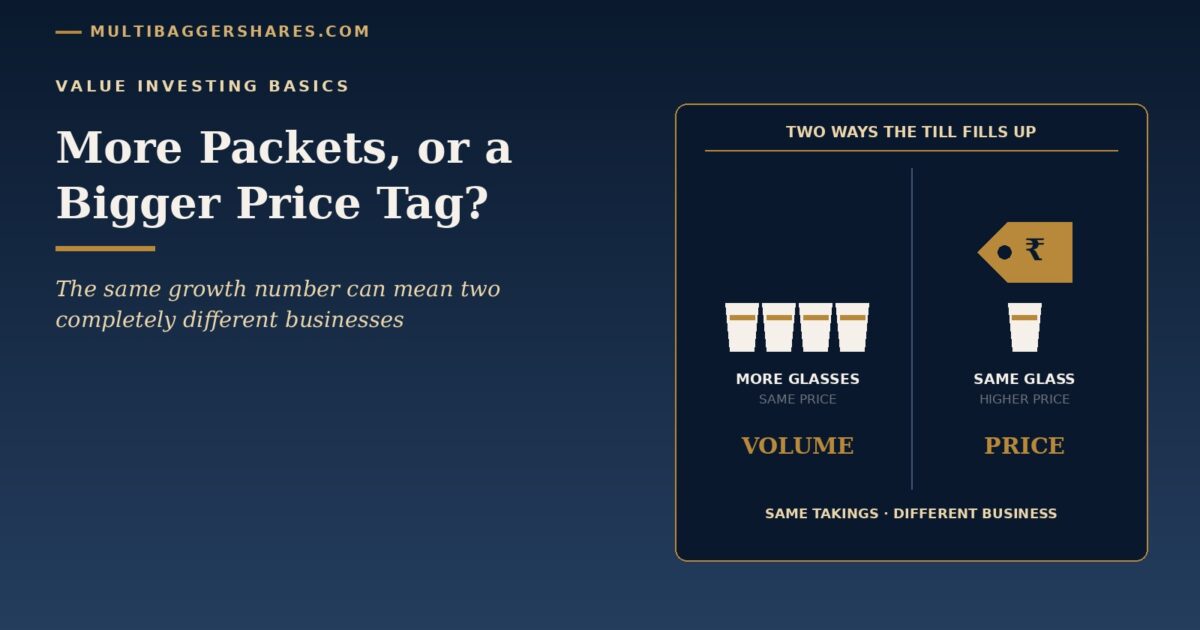
Two tea stalls on the same street
Picture two tea stalls standing side by side on a busy road. Ramesh runs one. Suresh runs
the other. Last year each of them sold about two hundred glasses of tea a day, and each charged ten
rupees a glass. Their takings were the same.
This year both men will tell you, quite honestly, that their business is up twenty per cent.
Ramesh now sells two hundred and forty glasses a day, still at ten rupees. Suresh still sells two
hundred glasses a day, but he now charges twelve rupees.
On paper the two stalls look identical. Twenty per cent more money in the tin at the end of
the day. If you were handed only the takings, you would not be able to tell them apart. Yet these are
not the same business, and they are not facing the same future.
Ramesh has forty more people drinking his tea every day than he had last year. Something
about his stall — the taste, the location, the hours, the smile — is pulling in customers
who used to go elsewhere. Suresh has exactly the same customers as last year, and each of them is
now handing over two rupees more.
Both of those can be good news. Both can also be bad news. But you cannot possibly know
which, until you ask the one question that separates them: did they sell more, or did they
just charge more?
That question is one of the simplest and most useful reading skills a beginner investor can
learn. It costs nothing. It needs no calculator. And almost nobody asks it, because the headline
number — “sales up twenty per cent” — is so satisfying that most readers stop
right there.
What a sales number is actually made of
When a company reports its sales for a period — you will also see it
called turnover or revenue (all three words mean the same thing: the total money customers paid the
company for its goods or services in that period) — that single figure is really two figures
multiplied together.
Sales = number of units sold × average price per unit. That is the
whole of the arithmetic. A soap company’s sales are the number of soap bars that left the
factory, multiplied by the average price each bar fetched. A cement company’s sales are the
tonnes of cement despatched, multiplied by the average price per tonne. A scooter company’s
sales are the number of scooters sold, multiplied by the average price per scooter.
Because there are two ingredients, there are two ways for the dish to get bigger. The
company can sell more units — what the industry calls volume growth (growth in
the actual quantity of goods sold, counted in bars, tonnes, litres or pieces, not in rupees). Or it
can get a higher average price for each unit — what is usually called price growth
or, in company language, realisation (the average rupees the company actually
realises, or receives, per unit sold).
Peter Lynch, the American fund manager who ran the Magellan mutual fund from 1977 to 1990
and then wrote a much-loved book for ordinary investors, put the same idea in a wider frame. In
One Up on Wall Street he set out the ways a business can make its profits bigger:
“There are five basic ways a company can increase earnings: reduce costs; raise prices; expand
into new markets; sell more of its product in the old markets; or revitalize, close, or otherwise
dispose of a losing operation.”
Look closely at that list. Two of the five items sit right at the top of the accounts, and
they are opposites in spirit. Raise prices is one lever. Sell more of its product
is a different lever. Lynch did not merge them, because they do not behave the same way over time.
Neither should you.
Why the split matters so much
Volume growth — more units going out of the gate — is a statement about
demand. It means more people wanted the thing this year than wanted it last year, or the
same people wanted more of it. That is hard to manufacture and hard to fake. Nobody buys a second
scooter to be polite.
Price growth is more complicated, because a higher average price can come from three quite
different places, and only one of them is a compliment to the business.
The first is that customers simply accepted a higher price and kept coming back. That is the
best kind, and it is rare. The second is inflation (the general rise in the price of
almost everything in the economy over time). If every soap in the country costs eight per cent more
this year, a soap maker whose prices rose eight per cent has not achieved anything — it has
merely moved with the tide. The third is mix (a change in which products
were sold, not how many). If a company sells the same one crore bottles as last year, but more of
them are the premium bottle and fewer the basic one, its average price per bottle rises without any
customer paying a rupee more for the same item.
So: the first kind of price rise is a compliment to the business. The second is a compliment
to the economy. The third is a compliment to the sales team — useful, but it can run out, because
there are only so many customers you can move up to the costlier bottle.
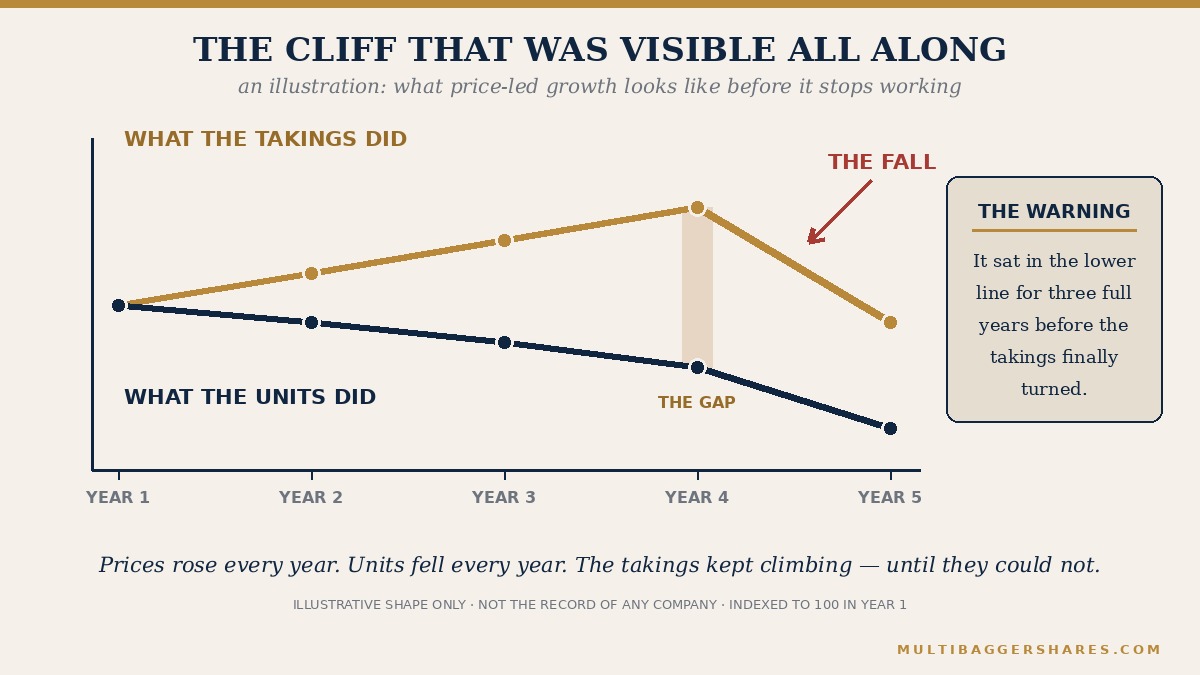
Here is the practical danger. A business whose unit sales are quietly shrinking can post
perfectly cheerful growth for two or three years by raising prices. The headline stays green. The
customers are walking away one by one. Then, in the fourth year, the volume decline becomes too big
to paper over, and the growth line falls off a cliff that seemed to come from nowhere. It did not
come from nowhere. It was visible in the volume figure the whole time, for anyone who looked.
The opposite mistake exists too. A company can buy volume. It can cut its price, offer
longer credit to its dealers, or push extra stock into the market at a discount, and the units will
duly go up. Volume bought that way is not the same as volume that was wanted. So the honest form of
the question is not “did units rise?” but “did units rise without the
price being sacrificed to make it happen?”
Three places in India where you can watch the split happen
The good news for an Indian reader is that many large companies here publish the split
themselves, in plain language, in their quarterly announcements. You do not have to compute
anything. You only have to read the sentence.
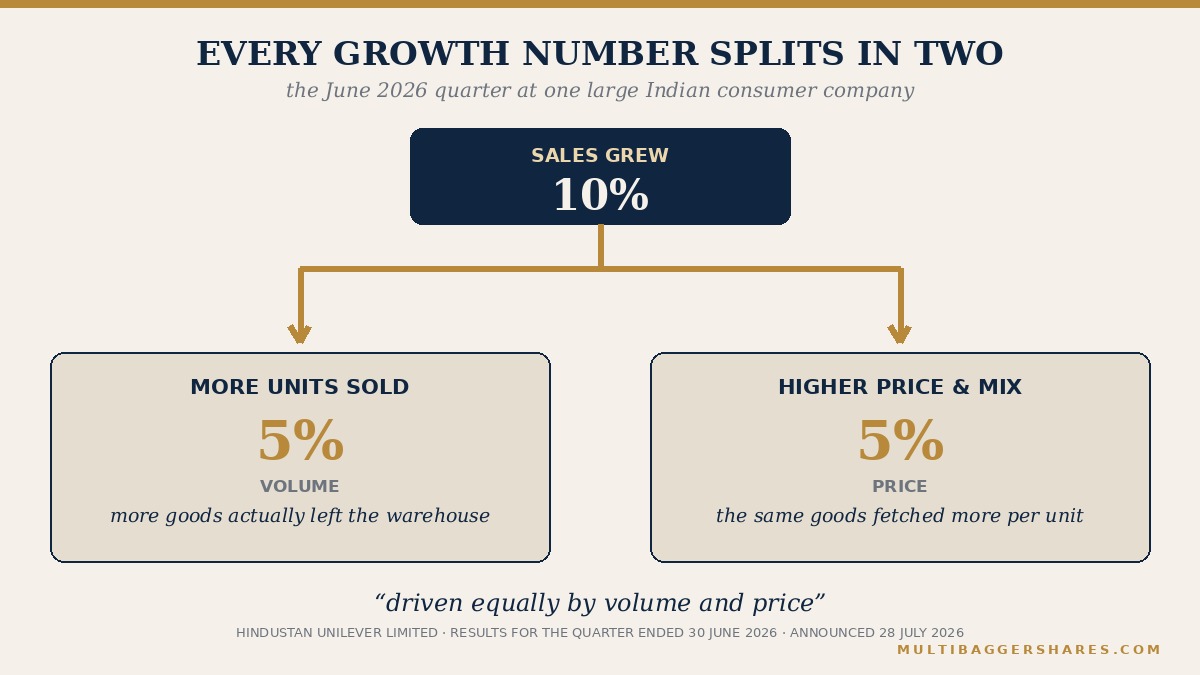
One: a balanced quarter. Hindustan Unilever Limited announced its results
for the quarter ended 30 June 2026 on 28 July 2026. Turnover for the quarter was ₹17,184 crore.
The company reported Underlying Sales Growth of 10 per cent and Underlying Volume Growth of 5 per
cent. In the company’s own footnotes, Underlying Sales Growth means the rise in turnover
excluding any change caused by buying or selling businesses, and Underlying Volume Growth means
volume growth including the effect of mix. The Chief Executive, Priya Nair, described the ten per
cent as “driven equally by volume and price.” Half the growth was more goods leaving the
warehouse; half was a higher average price per unit. That is a company telling you the split
without being asked.
Two: a price-led corner of the same company. In that very same
announcement, the Personal Care segment — soaps, bodywash, toothpaste — was described
differently: “Personal Care reported 4% USG led by pricing, as palm oil inflation persisted for
the second consecutive year.” Read that slowly. Growth of four per cent, led by pricing,
and the company itself names the reason: the cost of palm oil, an input it buys, had gone up for a
second year. That is not customers happily paying more. That is a cost being passed along the chain.
In the same release, the Coffee business was described as delivering “double-digit, volume-led
growth.” One company, one quarter, two segments, two completely different engines — and
the words led by pricing and volume-led are doing all the work.
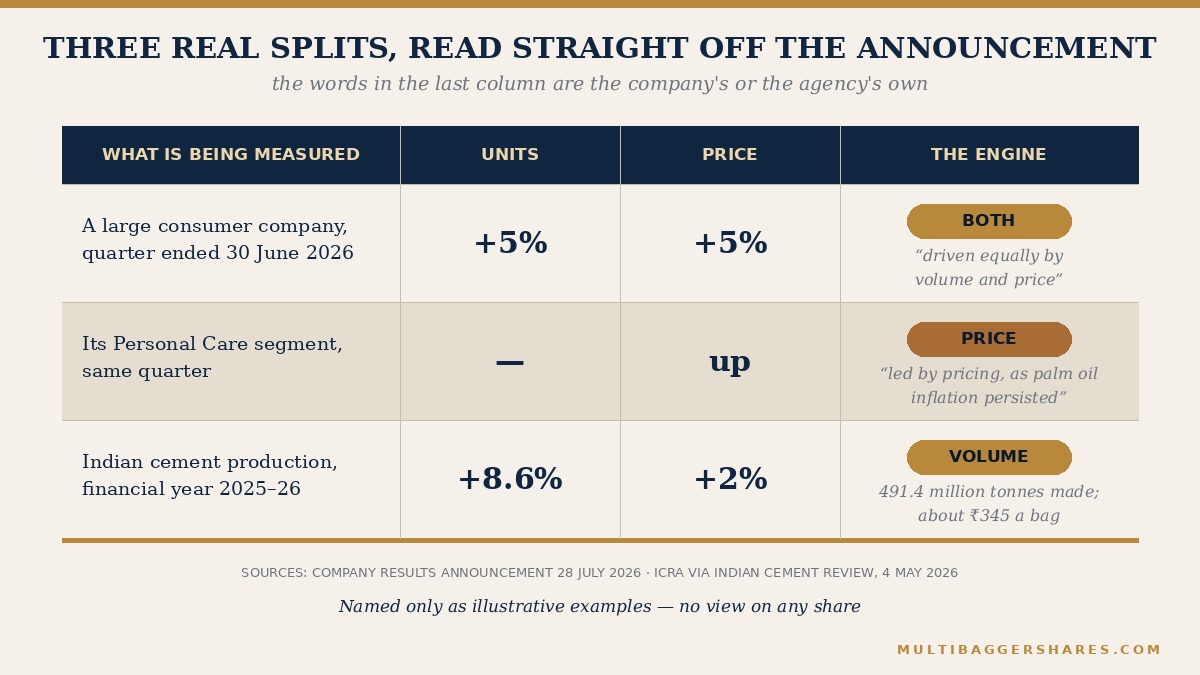
Three: a whole industry, volume-led. For the financial year 2025–26,
the rating agency ICRA reported that Indian cement production rose 8.6 per cent to 491.4 million
tonnes, while the average cement price rose about 2 per cent, to roughly ₹345 a bag (as
reported by Indian Cement Review on 4 May 2026). Here the pattern is the mirror image of the
soap example: a great deal more material actually moved, and prices barely budged. Something real was
being built. That is a demand story, not a price story.
Notice how much you learn from three sentences, none of which required you to open a
spreadsheet. And notice, too, what these figures do not tell you. The cement number is an
industry total; an individual cement company inside that industry may have done far better or far
worse. Always check whether the number in front of you belongs to the company or to its whole
neighbourhood.
When charging more is a good sign, and when it is a warning
Charging more is not a sin. Some of the finest businesses in the world raise their prices
every single year, and their customers hardly notice. The test is not whether the price went up. The
test is what happened around the price rise. Three questions settle it.
Did the customers stay? If the price went up and the number of units also
went up, or at least held flat, the customers voted with their wallets and stayed. That is the
strongest combination there is, and it is worth far more than a big headline growth number on its
own. If the price went up and the units fell, the company has borrowed from next year to make this
year look better.
Was the rise chosen or forced? A company that raises prices because it can
is in a different position from a company that raises prices because its raw material got expensive
and it had no choice. The second kind gives back the increase the moment the raw material cools off.
Company announcements often say which it was, in phrases like “calibrated pricing actions”
or, more bluntly, “led by pricing, as input costs rose.”
Was it one product or the whole basket? A rise that comes from one premium
launch is thinner than a rise that runs across the range. The first can be undone by a single
competitor; the second suggests something wider is going right.
Four things this test cannot tell you
This is a quality check, not a crystal ball, and it is worth being clear about its limits.
It says nothing about the share price. Whether the shares of a company are
worth owning at today’s price is an entirely separate question, and this letter does not go
there. Splitting growth into volume and price tells you about the business, not about the
market’s opinion of it.
Volume can be borrowed. As we said, units can be pushed into the trade with
discounts and easy credit. If volumes leapt while the money owed by dealers leapt further, the two
facts belong together.
Mix hides inside price. Most companies bundle mix into their price or
volume figure without separating it, so a “price” rise may really be a change in what was
sold. Read the words around the number, not just the number.
Not every business has units. A bank, an insurer, a software services firm
or a hospital does not sell a countable packet. For those, the equivalent question has to be built
from whatever the business does count — loans made, policies written, hours billed, beds
occupied — and the split is rarely as clean. Use the tool where it fits, and do not force it
where it does not.
Five questions to ask before you trust a growth number
One. Of the growth reported, how much was more units and how much was a
higher price per unit? If the company does not say, treat the number as unread.
Two. How does the price rise compare with general inflation over the same
stretch? Beating the tide by a little, year after year, is worth more than beating it hugely once.
Three. Did unit sales keep rising while the price rose? That
combination is the one worth hunting for.
Four. If volumes jumped, what happened to the money owed by customers and
to the stock lying in the warehouse? Growth that arrives with a swelling pile of unpaid bills is
worth less than growth that arrives with cash.
Five. Read four or five years of the split, not one. A single year tells
you about the weather. Five years tell you about the climate.
Do this for a few companies you already understand — the soap in your bathroom, the
biscuit in your tin, the cement in your neighbour’s new wall — and something quietly
changes. Growth stops being one number to be admired and becomes two numbers to be weighed. That is
the whole trick. Ramesh and Suresh both said their business was up twenty per cent. Only one of them
had more customers.
Key takeaways
- Every sales figure is two figures multiplied: how many units were sold, and the average price per unit.
- Volume growth is a statement about demand and is hard to fake; price growth may be genuine, may be inflation, or may just be a change in what was sold.
- A business with falling units can look healthy for two or three years on price rises alone — and then fall off a cliff that was visible all along.
- The strongest combination is a higher price and steady or rising units: the customers were asked for more and stayed anyway.
- Many Indian companies publish the split themselves in plain words — “volume-led”, “led by pricing” — so the work is reading, not arithmetic.
— Manish Goel · multibaggershares.com
Disclaimer: This article is for educational purposes only and does not constitute financial advice. The author may hold positions in stocks mentioned. Always conduct your own research and consult a SEBI-registered financial advisor before making investment decisions. Stock market investments are subject to market risks. Past performance does not guarantee future returns.