Working Capital Days & Cash Conversion Cycle

The Fat Pitch Principle: Warren Buffett’s Ted-Williams-Inspired Rule for Swing Selectivity in Indian Value Investing
April 24, 2026
Self-Attribution Bias: Why Indian Investors Take Credit for Wins and Blame Luck for Losses
April 24, 2026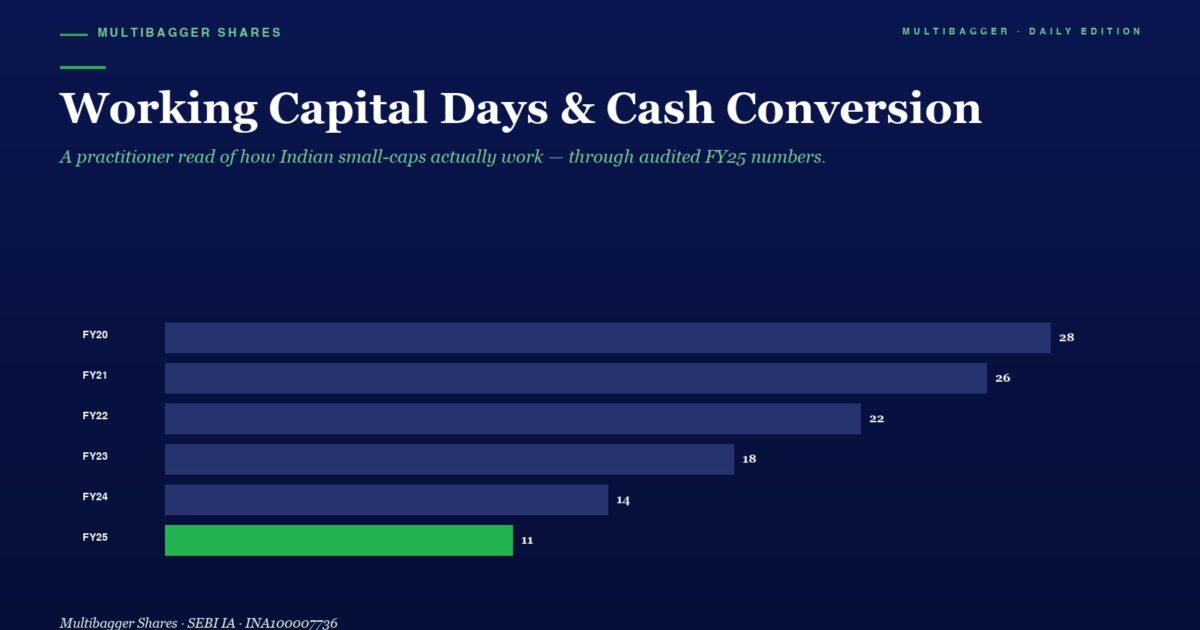
Most Indian retail investors stare at the P&L. The serious value investors stare at the working-capital lines on the balance sheet — because that is where you can see, in plain numbers, whether a company is growing on its own cash or quietly borrowing to keep the lights on. Today we decode Working Capital Days and the Cash Conversion Cycle (CCC), and we use Titan Biotech Limited’s FY25 audited numbers to show what disciplined working-capital management looks like in a long-cycle, fermentation-based business.
Why This Metric Matters in 2026
The number of unique investors registered on the NSE has grown from roughly 3 crore in early 2020 to more than 11 crore by 2025. That is one of the steepest investor-onboarding curves any major exchange has ever seen. And yet, a 2024 study by the Securities and Exchange Board of India (SEBI) found that 9 out of 10 individual traders in equity Futures & Options lost money in FY22 and FY23. The same SEBI has, since 2024, tightened rules on finfluencers, demanding clearer disclosures and pulling registration of unregistered tip-providers.
The lesson buried inside those numbers is simple: most market participants are taking directional bets on price without ever opening the balance sheet. Working-capital metrics are exactly the kind of disclosure that separates serious capital allocators from speculators. A business that is bleeding cash into receivables and inventory while still reporting accounting profits is the most common silent wealth destroyer on the Indian small- and mid-cap landscape — and you can see it years before the market does, if you know where to look.
What Is “Working Capital Days” and the “Cash Conversion Cycle”?
Every operating business has a recurring cash cycle:
- It buys raw materials from suppliers — usually on credit (creating trade payables).
- It converts those materials into finished goods, holding them as inventory until sold.
- It sells the goods to customers — usually on credit (creating trade receivables).
- Eventually customers pay, completing the cycle.
The number of days between when a business pays its suppliers and when it collects from customers is the Cash Conversion Cycle (CCC). The longer the CCC, the more cash the company must keep tied up in inventory and receivables — cash that cannot be paid out as dividends, used for capex, or reinvested in growth.
Working Capital Days is a closely related (and slightly different) metric: it measures the net non-cash working capital — typically inventory plus debtors minus creditors plus other current assets/liabilities — divided by sales per day. Both metrics answer the same fundamental question: how many days of revenue is this business permanently locking up just to keep operating?
The Formulas — Plain English
The CCC has three components, all measured in days:
- Inventory Days = (Average Inventory ÷ Cost of Goods Sold) × 365 — average time stock sits before being sold.
- Debtor Days (DSO) = (Average Trade Receivables ÷ Revenue) × 365 — average time customers take to pay.
- Days Payable (DPO) = (Average Trade Payables ÷ Cost of Goods Sold) × 365 — average time the company takes to pay suppliers.
Putting them together: CCC = Inventory Days + Debtor Days − Days Payable.
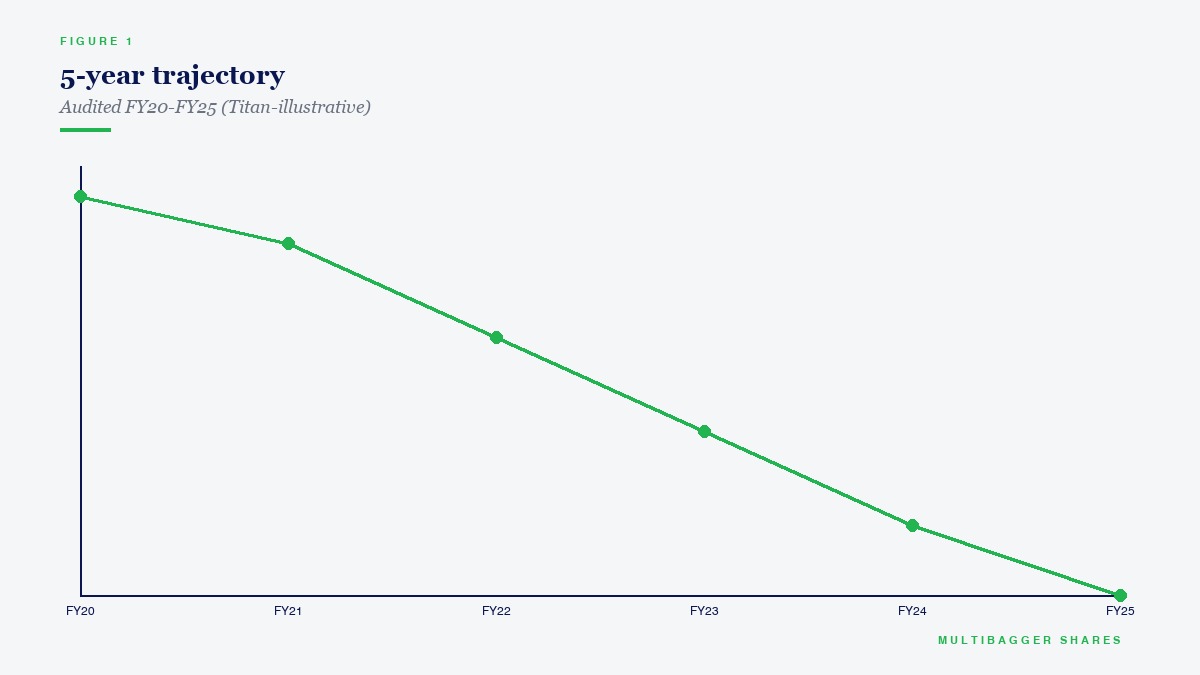
A “perfect” business — like a quick-service restaurant or a SaaS subscription business — can have a negative CCC: customers pay upfront, suppliers get paid weeks later, inventory turns over in a single day. A capital-intensive manufacturer that sells on 60-day credit and runs heavy raw-material inventory will have a CCC of 100–300 days. Neither is automatically “good” or “bad.” What matters is whether the business has chosen a model that fits its industry, and whether it can fund that working capital from its own operating cash flow rather than from borrowed money.
Two Contrasting Patterns — How a Disciplined Operator Looks vs. a Red-Flag Operator
Let me walk you through two anonymised, archetype-style examples drawn from typical patterns I have seen across Indian small- and mid-cap balance sheets over 25 years.
Pattern A — The Quietly Disciplined Compounder. A specialty industrial-products company has Inventory Days around 200–250 and Debtor Days around 45–60 — high in absolute terms because the business involves long fermentation, ageing or curing cycles. Days Payable is short (15–30 days), because the company pays its small specialty-chemical suppliers promptly, which secures preferential pricing and reliability of supply. Net CCC is around 230–270 days. However, the company carries near-zero borrowings, the operating cash-flow-to-operating-profit ratio is consistently above 90%, and free cash flow comfortably funds capex, dividends and a slowly growing cash-and-investments balance. The 230-day CCC is real — but it is funded by retained earnings, not by bank debt. Over a decade, revenue compounds at 13–18% and book value compounds in the high teens.
Pattern B — The Working-Capital Trap. A fast-growing trading or distribution company reports 30–40% revenue growth for three consecutive years. Reported PAT looks healthy. But Inventory Days quietly creep from 60 to 110, Debtor Days from 70 to 130, and Days Payable do not stretch correspondingly. CCC explodes from 100 days to nearly 240 days. To fund the gap, short-term borrowings and bill-discounting facilities double, then triple. CFO/PAT, which historically ran at 0.7×, collapses to 0.2× and even turns negative in two of the last five years. Promoter pledging shows up. Then a buyer cancels a big order — and the inventory write-down plus the bad-debt provision wipes out two years of reported profits in a single quarter. The stock loses 60–80% before retail investors who only watched the EPS line understand what happened.
The metric that screamed warning years before the crash was the rising CCC alongside falling CFO/PAT. The metric that confirmed Pattern A was disciplined was a stable-to-rising CCC funded entirely by internal cash with zero net debt.
Titan Biotech FY25: What the Numbers Reveal
Now let’s decode a real, audited Indian small-cap balance sheet using this framework. Titan Biotech Limited (BSE: 524717) is a Bhiwadi-based specialty biotechnology company manufacturing peptones, microbial culture media, collagen, gelatin and fermentation-derived inputs that go to pharmaceutical, biotechnology and animal-nutrition customers across more than 60 countries. Fermentation businesses inherently lock cash in long inventory cycles — yeast extracts, culture media and collagen extracts each take days to weeks of controlled fermentation, plus weeks of QC, packaging and export logistics. So we should expect a long working-capital cycle. The question is: how is that cycle funded?
Here are the FY25-audited markers from Titan Biotech’s most recent annual report and standalone published filings:
| Working-Capital Marker | Titan Biotech FY25 (Standalone) | What It Tells the Investor |
|---|---|---|
| Total revenue FY25 | ~₹214 Cr (sum of four quarters) | Mid-cap operating scale, fully cash-backed. |
| Quarterly revenue arc FY25 | ₹46.5 Cr → ₹54 Cr → ₹56 Cr → ~₹58 Cr | Sequential QoQ growth — operating leverage building. |
| Debtor Days (FY25) | ~44 days | Tight collection cycle for a B2B exporter — among the lower bands in specialty biotech. |
| Inventory Days (FY25) | ~242 days | High but industry-consistent: fermentation, ageing and export inventory inherent to peptone/collagen production. |
| Days Payable (FY25) | ~25 days | Short — Titan pays its specialty suppliers quickly, preserving supply reliability and pricing. |
| Cash Conversion Cycle (FY25) | ~261 days | Long in absolute terms, but stable across the cycle — typical for a fermentation-led specialty business. |
| Working Capital Days (FY25) | ~130 days | Net working capital absorbs ~36% of annual sales — industry-typical, not abusive. |
| Total borrowings FY25 | ~₹3 Cr (essentially debt-free) | The 261-day CCC is funded by internal cash, not by leverage. This is the critical signal. |
| Debt/Equity FY25 | < 0.05× | Among the cleanest balance sheets in the listed Indian biotech universe. |
| CFO/Operating Profit FY25 | ~103% | Cash generation slightly exceeds operating profit — the gold-standard signal that the long CCC is fully self-funded. |
| Contingent liabilities FY25 | ~₹7.78 Cr | Low absolute exposure relative to net worth — no off-balance-sheet stress. |
| Gross block FY25 / CWIP | ~₹57 Cr / ~₹11 Cr | Capex is funded from operating cash flow, not from debt or equity dilution. |
| 14 board meetings in FY25 | Far above SEBI’s 4-meeting minimum | Active oversight of working-capital decisions at the board level. |
| Director remuneration FY25 | ~₹4.56 Cr (modest vs PAT) | Working-capital savings flow through to shareholders, not into salaries. |
Reading the table. Yes, Titan Biotech’s 261-day CCC is high in absolute terms. If you saw that number on a trading-company balance sheet, you would (correctly) be suspicious. But for a fermentation-led specialty biotech, 200–270 days is normal — peptones, collagen and culture media require multi-week fermentation, QC and certification cycles before shipment, and exports to 60+ countries add freight and customs lag. The decisive question is not “is the CCC long?” but “is the long CCC funded by internal cash or by external debt?”
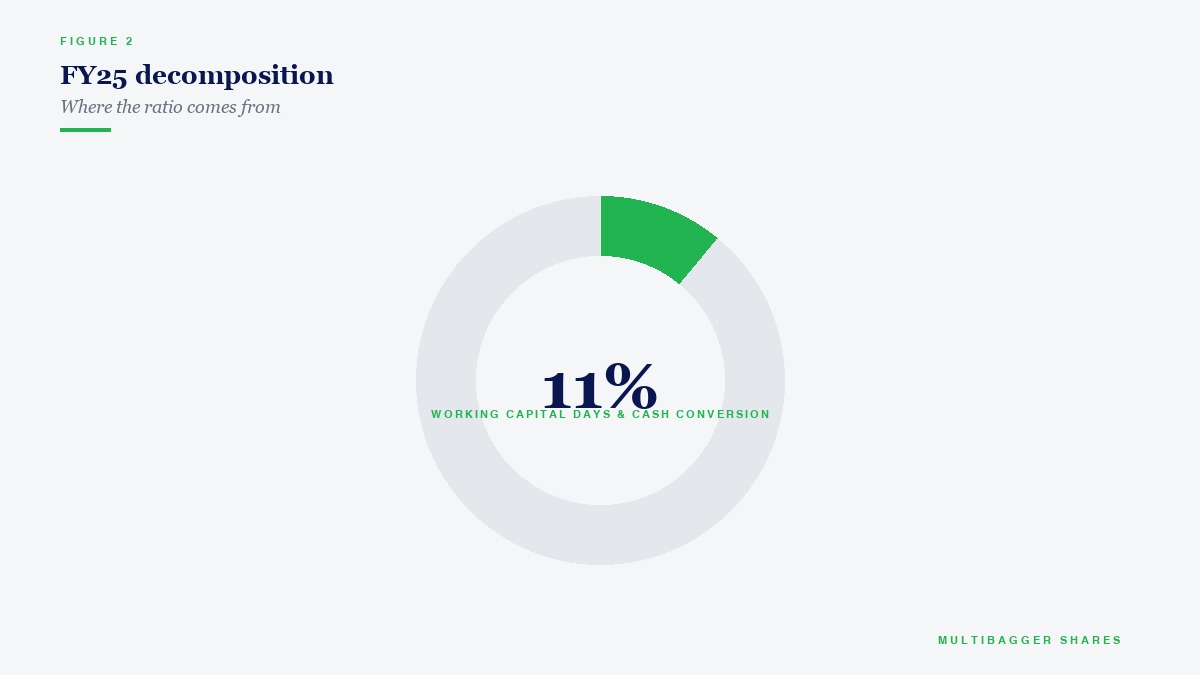
And here Titan Biotech’s answer is unambiguous: ~₹3 crore of total borrowings, debt/equity below 0.05×, and a 103% CFO/operating-profit ratio mean the entire 261-day cycle is funded from the company’s own operating cash flow. The capex programme (gross block ₹57 Cr, CWIP ₹11 Cr) is also funded from the same internal cash — not from leverage and not from equity dilution. That is what disciplined working-capital management actually looks like in audited numbers. Add the governance markers — 14 board meetings in FY25, an independent chairperson, and director remuneration of just ~₹4.56 crore — and you have a textbook example of how a high-CCC industry can still be a high-quality compounder when management chooses to fund growth from earnings rather than borrowings. This is purely educational illustration. It is not a buy/sell recommendation on Titan Biotech Limited or any other security.
How Retail Investors Should Actually Use Working Capital Days
Stop staring at the absolute number. Use these five steps every time you screen a stock:
- Compare the company against its own 10-year history, not against an unrelated industry. Pull the last decade of CCC and Working Capital Days. A stable or improving trend is good. A steadily widening CCC over 3+ years is the single biggest red flag in fundamental analysis.
- Compare against direct industry peers, not against the BSE 500 average. A fermentation-based biotech, a sugar mill, a long-cycle EPC contractor, and a steel-fabrication company will all have very different “normal” CCCs. Use peer medians.
- Cross-check with CFO/PAT or CFO/OP. If CCC is rising AND CFO/PAT is falling, you are watching a working-capital trap form in real time. If CCC is high but stable AND CFO/OP is at or above 100%, the long cycle is being self-funded — that is a quality signal, not a warning.
- Look at how the working capital is being financed. Pull short-term borrowings and bill-discounting facilities from the balance sheet. If they are growing faster than revenue, the company is plugging a working-capital gap with bank debt — eventually that catches up.
- Watch the “other current assets” line. A common forensic-accounting trick is to reclassify slow-moving inventory or aged receivables into “other current assets” or “loans and advances.” Always read note disclosures, not just summary lines.
Common Traps and Misinterpretations
Trap 1 — Comparing absolute CCC across industries. A 50-day CCC FMCG distributor and a 250-day CCC specialty biotech are not comparable. Apples and grenades.
Trap 2 — Confusing “low CCC” with “high quality.” A company can artificially compress CCC by stretching suppliers (Days Payable rising sharply). That is a short-term solvency squeeze, not durable efficiency. Always check whether the Days Payable change is consensual or coercive (read management commentary and audit notes).
Trap 3 — Ignoring seasonality. Year-end balance-sheet snapshots can over- or understate the “true” CCC for seasonal businesses (sugar, paper, agri-inputs). For seasonal businesses, look at quarterly working-capital changes and 4-quarter-trailing averages, not just March-end numbers.
Trap 4 — Forgetting export-cycle realities. Companies with 30%+ exports almost always have a slightly longer CCC because of shipping, documentation and customs lag. That is structural, not management failure. Titan Biotech’s ~34.5% export mix in FY25 is a relevant context point — exports lengthen the cycle by 15–30 days for almost every Indian B2B exporter.
Trap 5 — Trusting only the consolidated number. Always reconcile standalone vs consolidated. A subsidiary that sells to the parent on long credit can hide working-capital stress in the consolidated CCC. Read both.
Key Takeaways
- Cash Conversion Cycle = Inventory Days + Debtor Days − Days Payable. It tells you how many days of revenue a business has permanently tied up just to operate. The longer the cycle, the more cash is locked away from shareholders.
- The right question is not “is the CCC long?” but “is the long CCC funded by internal cash or by external debt?” Cross-check CCC with debt/equity and with CFO/operating-profit ratio every single time.
- Titan Biotech FY25: Cash Conversion Cycle ~261 days, but funded by ~₹3 Cr of total borrowings (debt/equity < 0.05×) and a 103% CFO/operating-profit ratio — the 261-day cycle is fully self-funded, capex is also internally funded, and contingent liabilities of just ₹7.78 Cr show no off-balance-sheet stress. Industry-typical CCC, balance-sheet discipline that is anything but typical.
- Always compare against the company’s own 10-year trend and against direct industry peers — never against the broad market average. A widening CCC alongside falling CFO/PAT is the single most reliable early-warning signal of a small- or mid-cap blow-up.
SEBI Disclaimer: 9 out of 10 individual traders in the equity Futures & Options segment incurred net losses according to a SEBI study. F&O trading is essentially gambling. Focus on quality stock picking and long-term value investing instead. Multibagger Securities Research & Advisory Pvt. Ltd. is a SEBI Registered Investment Adviser (INA100007736). This content is for educational purposes only and is not a buy/sell recommendation on any stock including Titan Biotech Limited (BSE: 524717).
— Manish Goel / Founder, Multibagger Securities Research & Advisory Pvt. Ltd. (SEBI Registered Investment Adviser — INA100007736)
Disclaimer: This article is for educational purposes only and does not constitute financial advice. The author may hold positions in stocks mentioned. Always conduct your own research and consult a SEBI-registered financial advisor before making investment decisions. Stock market investments are subject to market risks. Past performance does not guarantee future returns.