The Forty Kinds of Biscuit: Why the Best-Selling Product Often Pays for the Worst One

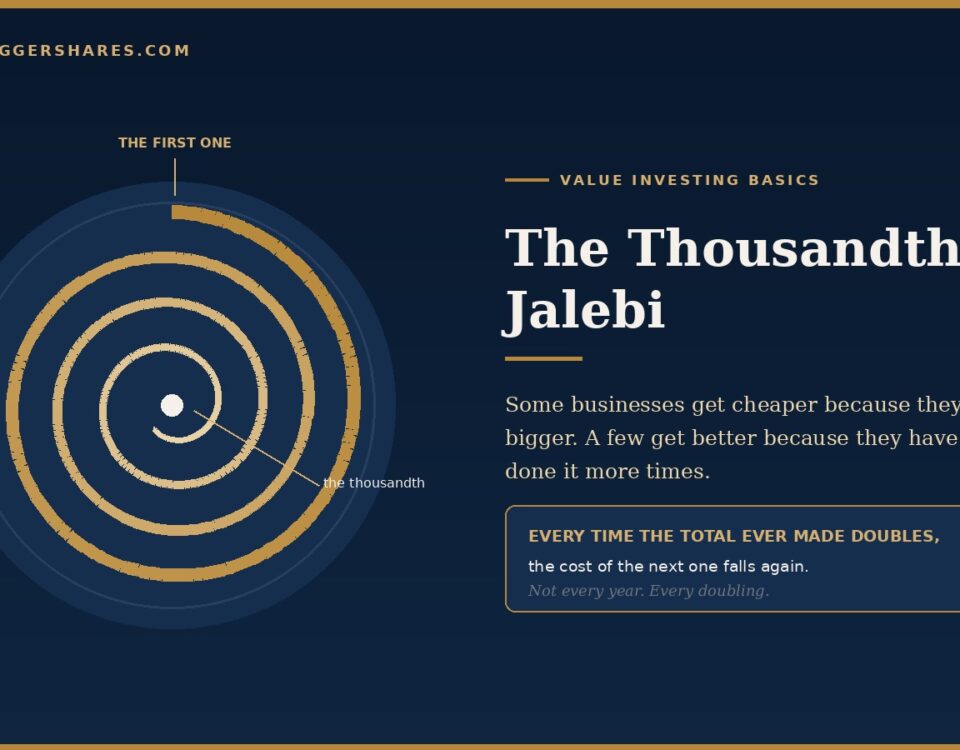
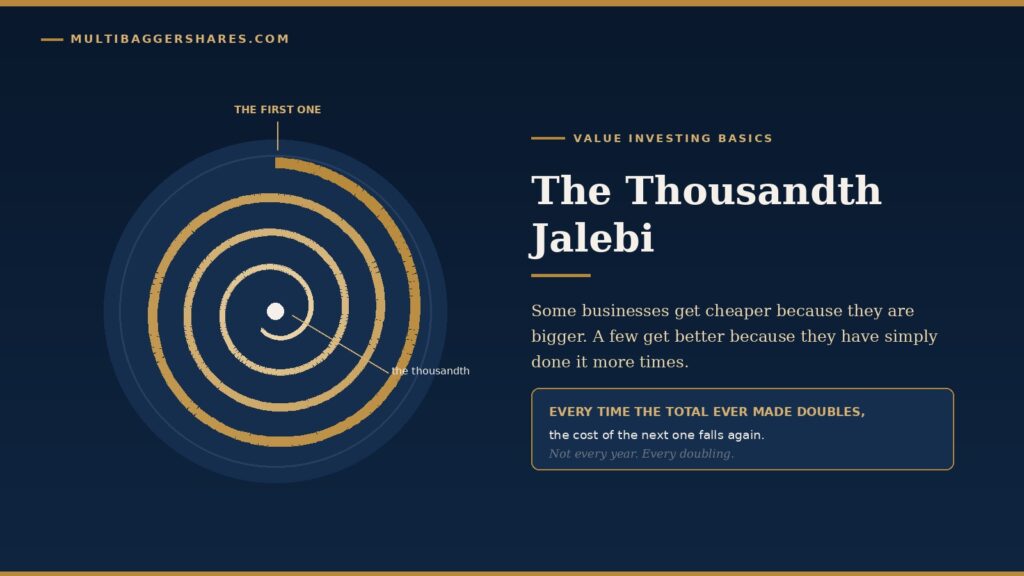
The Thousandth Jalebi: How to Tell Real Learning in a Business From a Bigger Machine
September 20, 2026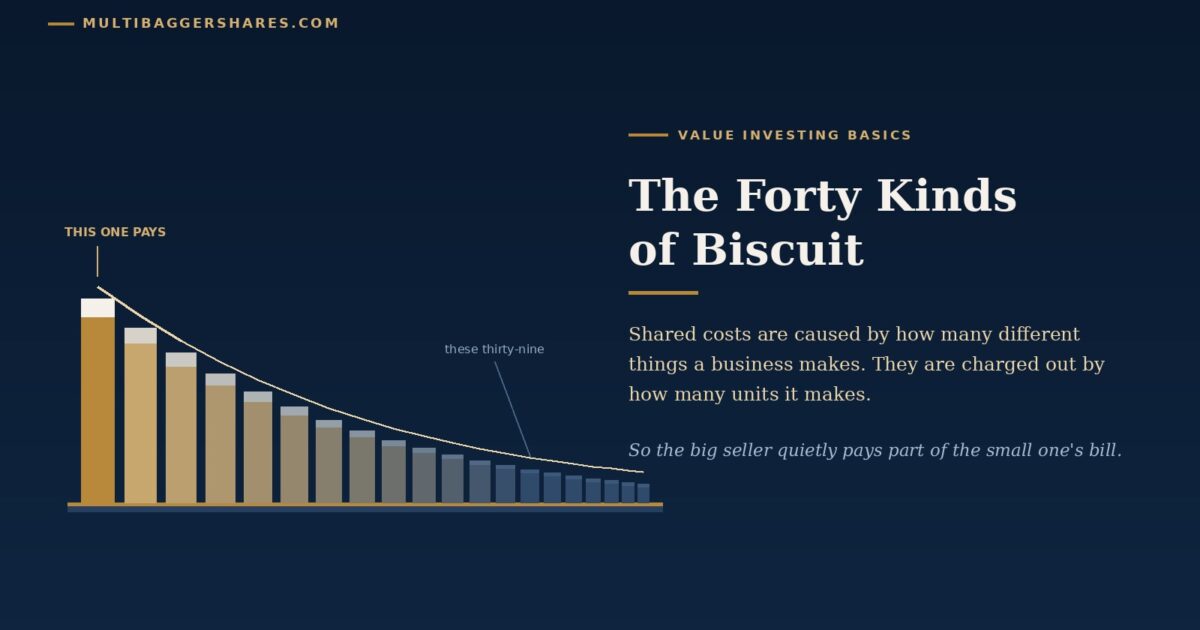
Walk into a well-run bakery and count the biscuits. Not the packets — the kinds. Butter, coconut, jeera, ajwain, chocolate, orange, sugar-free, a thin one for tea, a thick one for children, a festival one that appears in October. Forty kinds is not unusual.
Now ask the owner a harder question. Which of the forty actually make money?
If he keeps proper books, he will pull them out and show you that they all do. Each kind is sold above what it costs. The costing sheet says so. And he will be wrong about roughly half of them, through no dishonesty of his own, because the way almost everybody keeps a costing sheet hides the single largest cost of a long list.
This is one of the most useful things a beginner can learn to see in a business, and almost nobody looks for it.
What a long list actually costs
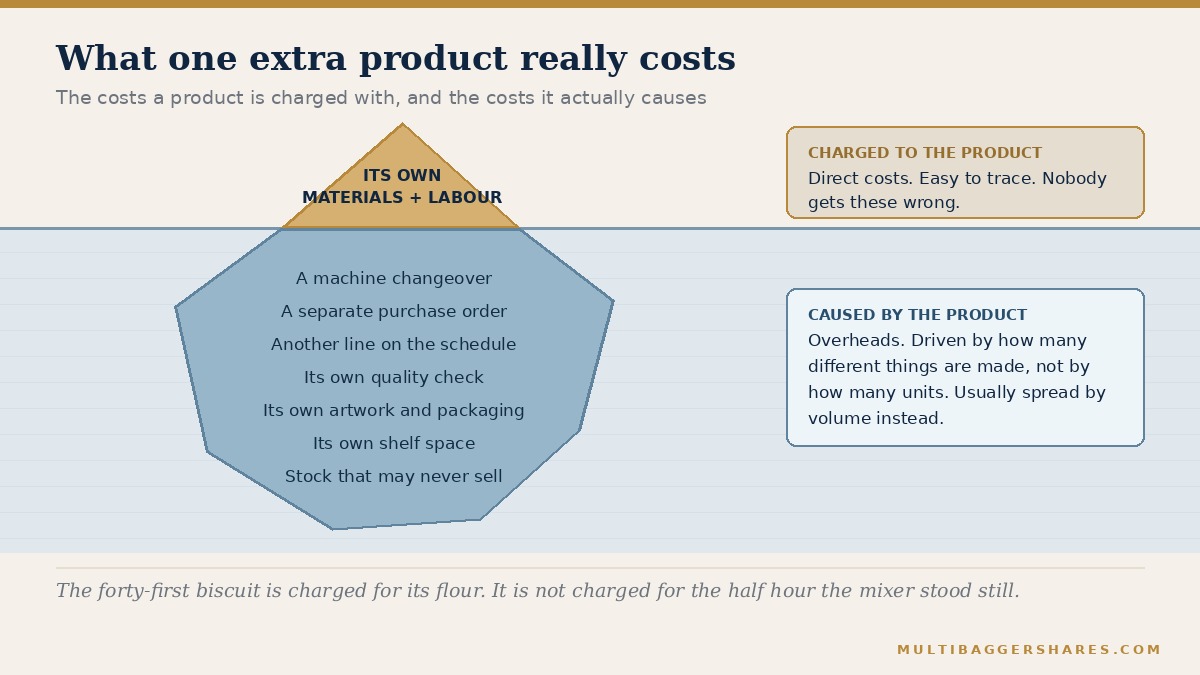
Start with the thing that is easy to count. If the bakery adds a forty-first biscuit, it buys some flour and some flavouring and pays someone to mix it. Those are direct costs — costs you can point at and say, that rupee went into that biscuit. Direct costs are honest. Nobody gets those wrong.
Now count the things that are hard to count. The mixer has to be stopped, emptied and cleaned before the new flavour goes in, and that is half an hour when nothing is being made. Somebody has to place a separate order for the new flavouring and chase it when it does not arrive. Somebody has to fit the new biscuit into the week’s baking schedule, which means moving everything else. The wrapper needs a new design and its own printing plate. The quality check is a separate check. The van has one more line on its delivery sheet. The shop has one more row on its shelf, and if the new biscuit does not sell by the date on the packet, that stock is simply thrown.
Not one of those costs is caused by how many biscuits the bakery makes. Every one of them is caused by how many different kinds it makes. That is the whole idea, and it is worth reading twice, because the entire confusion flows from missing it.
These are called overheads — the shared costs of running the place, which no single product can be said to own. Rent, supervision, scheduling, purchasing, inspection, the office. In a small hand-run bakery overheads are a modest share of the total. In a modern factory, where machines have replaced much of the labour, overheads are often the largest cost in the business. And they are the costs that variety drives.
Why the accounts do not show it
Here is the mechanical bit, and it is simpler than it sounds.
Because no single product owns a shared cost, the accountant has to spread it somehow. The ordinary method — the one taught for a century and still used nearly everywhere — is to spread it in proportion to something big and easy: units made, or labour hours, or sales value. If the butter biscuit is forty per cent of the units, it is charged forty per cent of the overheads.
Read that again with the festival biscuit in mind. The festival biscuit is one per cent of the units. So it is charged one per cent of the overheads — even though it caused a full machine changeover, its own purchase order, its own artwork, its own inspection and a pile of unsold stock in November. Meanwhile the butter biscuit, which runs for three uninterrupted days and causes almost no fuss at all, is charged forty per cent.
So the costing sheet quietly does two things at once. It makes the big simple product look dearer than it is, and it makes the small fiddly product look cheaper than it is. The plain English word for this is cross-subsidy: one product paying part of another product’s bill without anyone deciding that it should. As the standard description of the problem puts it, when several products share common costs there is a danger of one product subsidising another.
Two American accounting professors, Robin Cooper and Robert Kaplan, set this out in the Harvard Business Review in September 1988 in an article called ‘Measure Costs Right: Make the Right Decisions’. Their charge was blunt: managers in companies selling many products were making decisions about “pricing, product mix, and process technology based on distorted cost information”. Worse, nothing in the accounts warned them. Most companies, the authors wrote, only discovered the problem after their profitability had already deteriorated.
The two pen factories
Cooper and Kaplan explained it with an example so clean it has been taught ever since. Imagine two factories making ballpoint pens. Same size. Same machines. Same total output.
The first factory makes one million blue pens a year. That is all it makes.
The second factory makes one million pens a year as well — but only 100,000 of them are blue. The rest are 60,000 black, 12,000 red, 10,000 lavender, and so on down a list of roughly a thousand different products, added over the years to keep the plant full and the workers busy.
Stand outside and the two factories look identical. Walk inside and they are not remotely alike. The second one needs a scheduling department, because a thousand products have to be slotted into a calendar. It needs a far larger purchasing department, because a thousand products need a thousand sets of inputs. It changes its machine settings constantly. It inspects more, stores more, moves more and writes off more. Its offices are full of people whose entire job exists because of variety.
Now do the arithmetic the ordinary way. Spread all those extra office costs across a million pens by volume, and the blue pen in the second factory appears to cost almost exactly what the blue pen in the first factory costs. It does not. It is carrying the lavender pen on its back. And the lavender pen — which on paper looks like a nice little profitable speciality — is being carried.
Peter Drucker made the same point in a single sentence in 1999. Traditional cost accounting, he wrote in Management Challenges of the 21st Century, records the cost of doing something — the cost of cutting a screw thread. The better method also records the cost of not doing: the cost of waiting for a part that has not arrived. In a long product list, an enormous amount of money is spent on not doing.
Two companies that counted again
None of this stayed theoretical. Two of the largest consumer-goods companies in the world eventually took a hard look at their own lists. Both stories are told here purely as history; nothing in this letter is a comment on anyone’s shares.
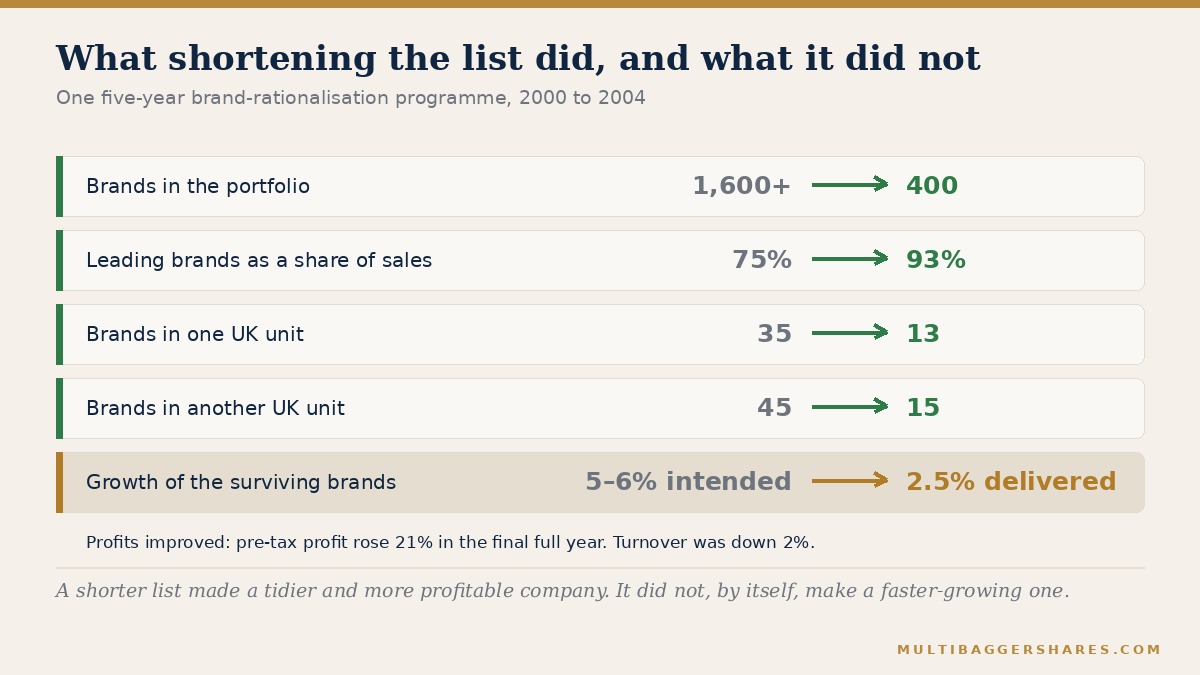
In February 2000 Unilever announced a five-year plan called Path to Growth. At the start it owned more than 1,600 brands. The target was 400. By the time the plan was winding down in 2004 the portfolio had come down to around 540 and was on course for the 400. Its leading brands, which had been 75 per cent of sales in 1999, were 93 per cent of sales by 2003, against a target of 95. The money saved did not sit idle: some £18.1 billion went into advertising and promoting the brands that survived. In 1999 the company had four brands selling more than a billion euros a year. Ten years before that it had one. By 2004 it had twelve. Inside the UK businesses the cut was even sharper — one unit went from 35 brands to 13, another from 45 to 15, with the number it actually advertised falling from 22 to seven.
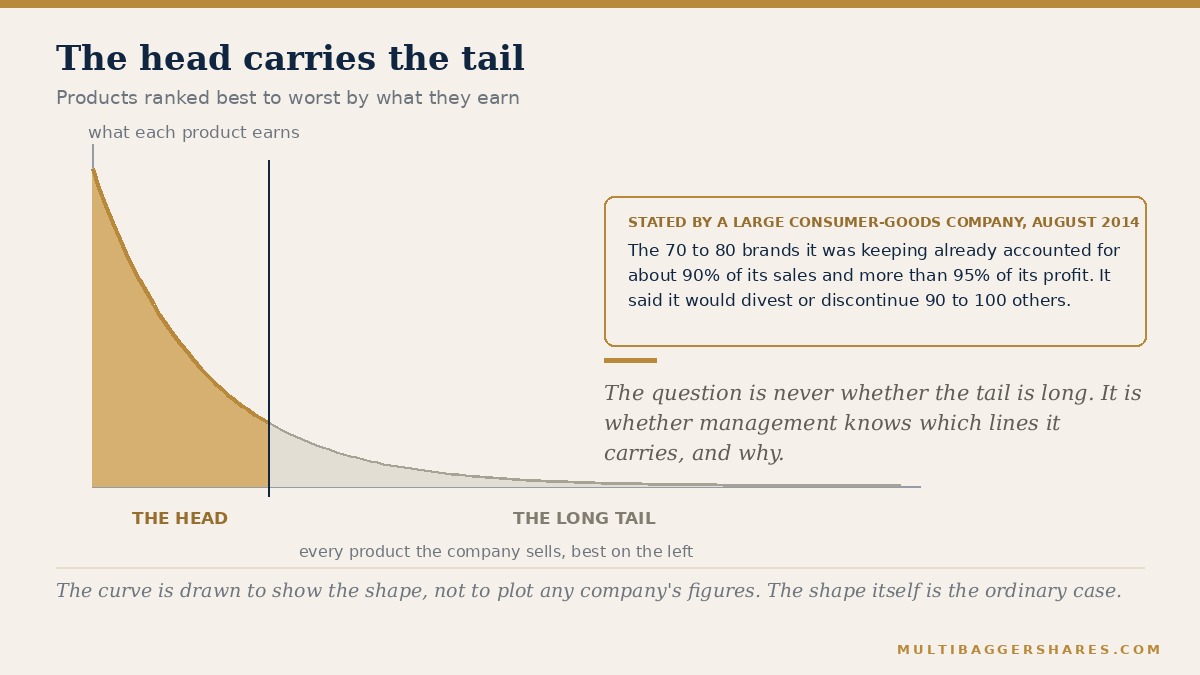
Fourteen years later, in August 2014, Procter & Gamble said something similar out loud. It would divest or discontinue 90 to 100 brands over the following two years and concentrate on 70 to 80. The reason it gave is the sentence worth keeping: those 70 to 80 brands already accounted for about 90 per cent of the company’s sales and more than 95 per cent of its profit. The other hundred-odd brands, between them, were contributing roughly a tenth of the revenue and almost none of the earnings — while consuming, one may reasonably assume, far more than a tenth of everybody’s attention.
A short head that earns nearly everything, a long tail that earns nearly nothing: that shape is ordinary. Finding a company whose list does not look like it is the unusual event.
The objection that keeps this honest
Now the part that most articles on this subject leave out, and which matters more than everything above.
Cutting the list is not automatically the right answer, and counting more carefully has its own trap. The careful method works by taking costs that are genuinely fixed — the rent, the supervisor’s salary, the machine that is already bought and paid for — and attaching them to individual products. That is useful for seeing which products cause work. But it makes fixed costs look variable, as though they would leave the building if the product did. Usually they would not. Drop the line the new calculation calls unprofitable, and you may find the rent unchanged and the supervisor still employed. The contribution has gone. None of the cost went with it.
Some costs cannot honestly be attached to any product at all. The chief executive’s salary is the standard example: a cost of the business existing, not of any particular biscuit. Every product together must cover it. No single product can be said to cause it.
Unilever’s own record carries the same warning. On margins the plan worked: in that final full year pre-tax profits rose 21 per cent. On growth it did not. The surviving leading brands grew 2.5 per cent against an intention of 5 to 6 per cent, and total turnover was actually down 2 per cent on the year before. A shorter list made a tidier, more profitable company. It did not, by itself, make a faster-growing one. Some of what was cut had been earning its keep in places the head office could not see.
And the counting itself costs money. When one large public body reviewed its use of the detailed method in 2008, the conclusion was that done by hand it was expensive, difficult to implement, delivered small gains and was poor value. A tool for occasional hard thinking, in other words, not a permanent second set of books.
A long tail is sometimes the point
One more caution, because the opposite mistake is just as easy.
A long list is a cost. It is not always a waste. The hardware shop that stocks the one odd-sized bolt nobody else keeps loses money on that bolt and wins the customer’s whole basket, and every future basket, because of it. A pharmacy that stocks only the fast movers is not really a pharmacy.
So the question is never “is the list long?” The question is: does management know which of the two it is looking at, and can it say so plainly? A company that keeps a loss-making line deliberately, and can tell you exactly why, is in good shape. A company that keeps forty lines because nobody has ever counted, and believes all forty are profitable because the costing sheet says so, is the one to be wary of.
It is worth separating this from two nearby ideas the series has covered before. Wandering into unrelated businesses — Peter Lynch’s ‘diworsification’ — is a different disease; this one happens entirely inside a single business that never left its own factory. And refusing badly-priced customers is a question of price discipline, where the damage is visible in the margin. Here the damage is invisible, because it is sitting in the overhead line where nobody thinks to look for it.
It is also the exact opposite of a more famous advantage. Making more of the same thing gets cheaper per unit — that is scale. Making more different things gets dearer per unit. Both forces work inside the same factory at the same time, pulling in opposite directions, and a long list is one of the commonest ways a company cancels out the scale it has spent years building.
How you can use it
You cannot audit a company’s cost system from outside. You can, however, do four things, none of which requires a spreadsheet.
First, count the list. Annual reports, product pages and dealer catalogues will usually tell you roughly how many products, brands, variants or models a company sells. Then look for any statement about how much of the revenue the top handful produces. If a company volunteers that figure, it has counted. If it never mentions it anywhere, that silence is information.
Second, watch the direction of travel. A list that only ever gets longer, year after year, with launches announced and discontinuations never mentioned, is a list nobody is pruning. Additions are easy and get a press release. Subtractions are hard and are done quietly by people who are willing to be unpopular.
Third, listen for the language. Management that talks about ‘focus’, ‘complexity reduction’, ‘range rationalisation’ or number of stock-keeping units is management that thinks about this at all — which already puts it in a minority. Management that answers every question about a weak product by saying it is ‘profitable at the gross level’ has told you which costing method it uses and which costs it is leaving out.
Fourth, look at where the inventory sits. Slow-moving stock, write-offs and provisions for obsolete goods tend to cluster in the tail of the list. A company whose inventory keeps growing faster than its sales is often a company whose tail is growing faster than its head.
And keep it in proportion. A disciplined product list tells you something real about how a business is run, and nothing whatsoever about anything else. The company still has to earn a decent return on the capital it employs, still has to avoid owing more than it can comfortably service, still has to turn reported profits into cash that actually arrives. A short, well-understood list is a good reason to look closer. It is never a reason to stop looking.
Key takeaways
- Most shared costs in a modern business are driven by how many different things it makes, not by how many things it makes — but the ordinary costing method spreads them by volume.
- The result is cross-subsidy: the big simple product is overcharged and looks worse than it is, the small fiddly product is undercharged and looks better. Cooper and Kaplan called it “distorted cost information” in 1988 and the method they criticised is still the common one.
- Two ballpoint-pen factories of identical size making a million pens a year are not comparable if one makes one product and the other makes a thousand. The blue pen in the second one is carrying the lavender pen.
- A short head and a long tail is normal: one large company stated in 2014 that the 70 to 80 brands it was keeping already made about 90 per cent of sales and over 95 per cent of profit.
- But cutting is not automatically right. Attaching fixed costs to products makes them look variable when they are not, and one famous five-year cull improved profits while missing its growth target — the real test is whether management knows which lines it is carrying, and why.
— Manish Goel · multibaggershares.com
Disclaimer: This article is published by multibaggershares.com for education and general information only. It is not investment advice, investment research, or a recommendation to buy, sell or hold any security. Any companies named are discussed only as illustrative examples. Markets carry risk; please do your own research or consult a qualified professional before making any investment decision.