Receivable Days: The Working-Capital Ratio That Reveals Whether Reported Profit Has Actually Turned Into Cash

The Small Print Nobody Reads: Why the Notes Behind a Company’s Numbers Matter
September 26, 2026
The Well That Everyone Used, Until Nobody Did: How to Notice a Business Edge That Is Quietly Draining Away
September 27, 2026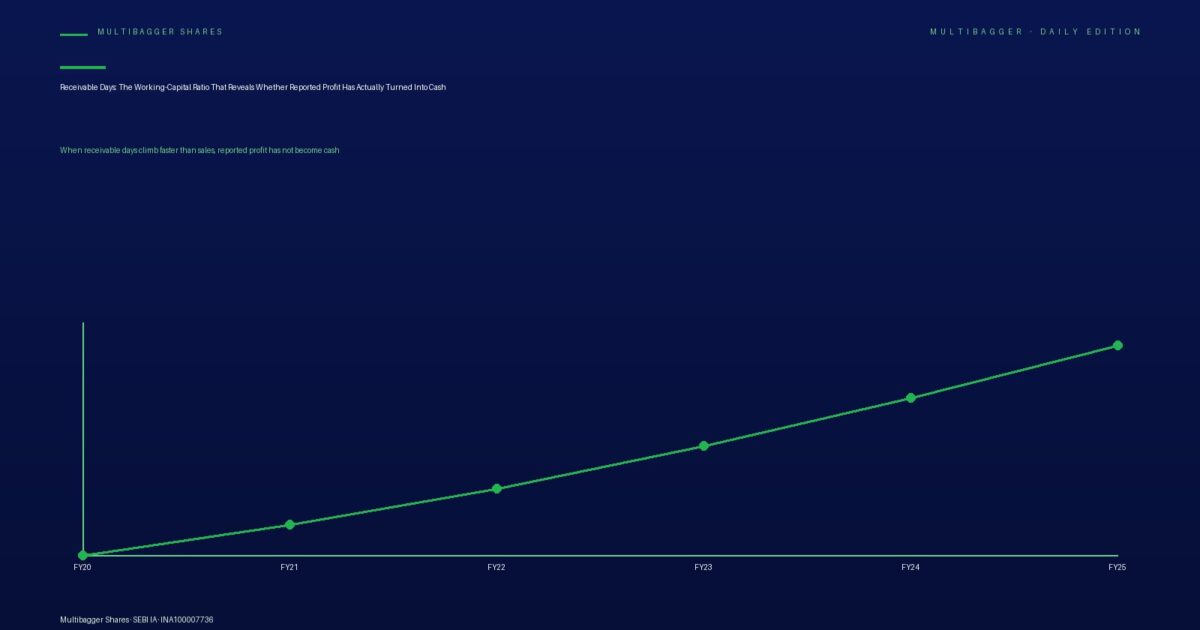
A SEBI study found that roughly 9 out of every 10 individual traders in the equity derivatives segment lost money — a reminder that the fastest way to lose capital in Indian markets is to mistake activity for analysis. The slower, duller work of reading a balance sheet rarely makes headlines, yet a single line buried in the current-assets section quietly tells you whether a company’s reported profit is real cash or merely an accounting promise. That line is trade receivables, and the ratio that decodes it is receivable days.
Every quarter, thousands of Indian companies announce record profits. The profit-and-loss statement is the headline; it is also the easiest of the three financial statements to dress up. Revenue can be booked the moment an invoice is raised, long before a single rupee arrives in the bank. This is where receivable days earns its place in every serious investor’s toolkit. It answers one deceptively simple question: after a company records a sale, how many days does it actually wait to be paid? The answer separates businesses that sell to willing, solvent customers from those that are effectively lending money to keep their growth story alive.
What Receivable Days Actually Measures
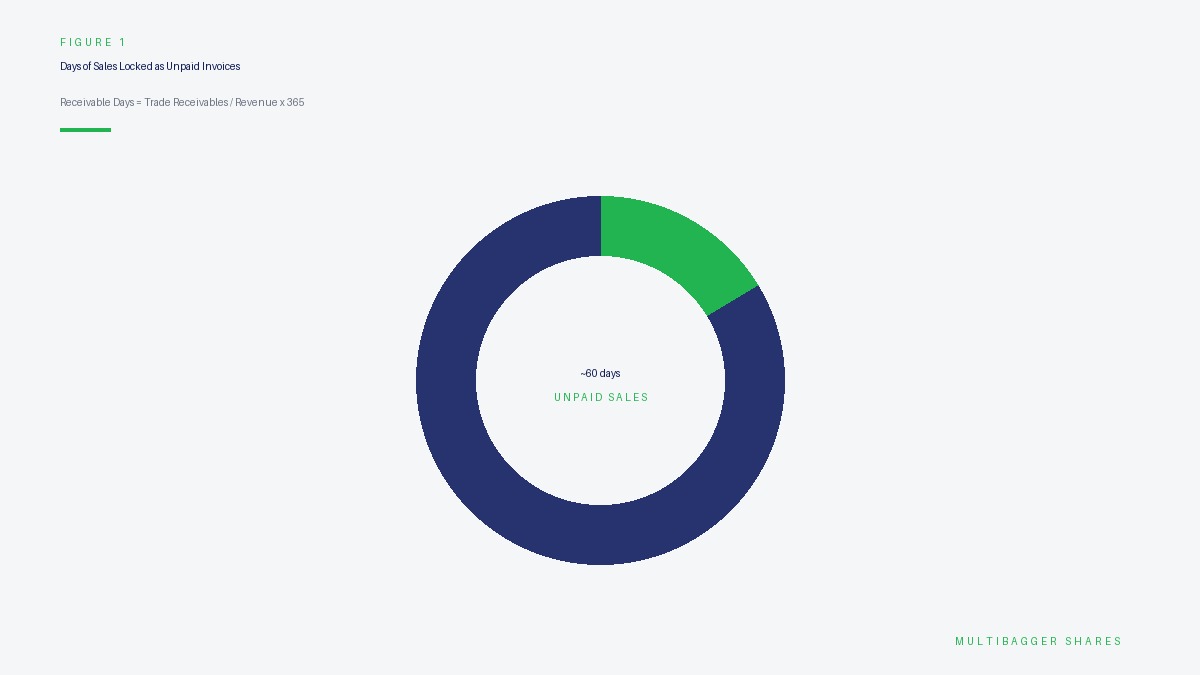
Trade receivables — often called sundry debtors on older Indian balance sheets — represent money customers owe the company for goods already delivered or services already rendered. When you sell on credit, you record the revenue immediately, but the corresponding cash sits with your customer until they choose to pay. Receivable days measures the average length of that waiting period across a full year of sales. It is, in plain terms, the number of days of sales that are locked up as unpaid invoices at any given moment.
A low and stable receivable-days figure signals that customers pay promptly, that the company has pricing power and disciplined credit control, and — crucially — that reported sales are converting into real cash. A rising figure is one of the earliest and most reliable warning signs in forensic accounting. It can mean the company is loosening credit terms to push sales it could not otherwise make, that customers are in financial distress, or, in the worst cases, that revenue is being inflated with sales that will never actually be collected. Long before a fraud shows up in the profit line, it usually shows up here first.
The formula is simple, but reading it well is not. Suppose a company reports annual revenue of ₹365 crore and carries ₹60 crore of trade receivables at year-end. Dividing ₹60 crore by ₹365 crore gives 0.164, and multiplying by 365 days gives roughly 60 receivable days. In other words, on any given day the business is waiting on about two months’ worth of sales. Whether 60 days is healthy or alarming depends entirely on the industry and — more importantly — on the trend. A software services firm collecting in 60 days may be perfectly normal; a fast-moving consumer goods company that suddenly jumps from 20 days to 60 has a story it needs to explain.
How to Read the Number Like an Analyst
The single most common mistake retail investors make with receivable days is judging it in isolation. A number means nothing without three points of comparison. First, compare the company against its own history: plot receivable days across five to ten years. A flat or falling line is reassuring; a steadily climbing line demands an explanation. Second, compare against direct competitors in the same industry, because collection norms differ wildly between sectors — a capital-goods maker selling to government utilities will always carry more receivable days than a retailer collecting cash at the till. Third, compare the growth rate of receivables against the growth rate of revenue. If receivables are growing meaningfully faster than sales, the company is buying its growth on credit, and that growth is lower quality than the headline suggests.
There is a second, more powerful cross-check that too few investors perform. Receivable days lives on the balance sheet, but its truth is confirmed on the cash-flow statement. If a company reports rising profits but its cash flow from operations consistently lags behind, and its receivable days are climbing at the same time, you are almost certainly looking at profits that exist on paper but not in the bank. Conversely, a company whose operating cash flow keeps pace with — or exceeds — its operating profit is one whose sales are genuinely being collected. The two statements corroborate each other, and a disciplined analyst never trusts one without checking the other.
Two Contrasting Pictures
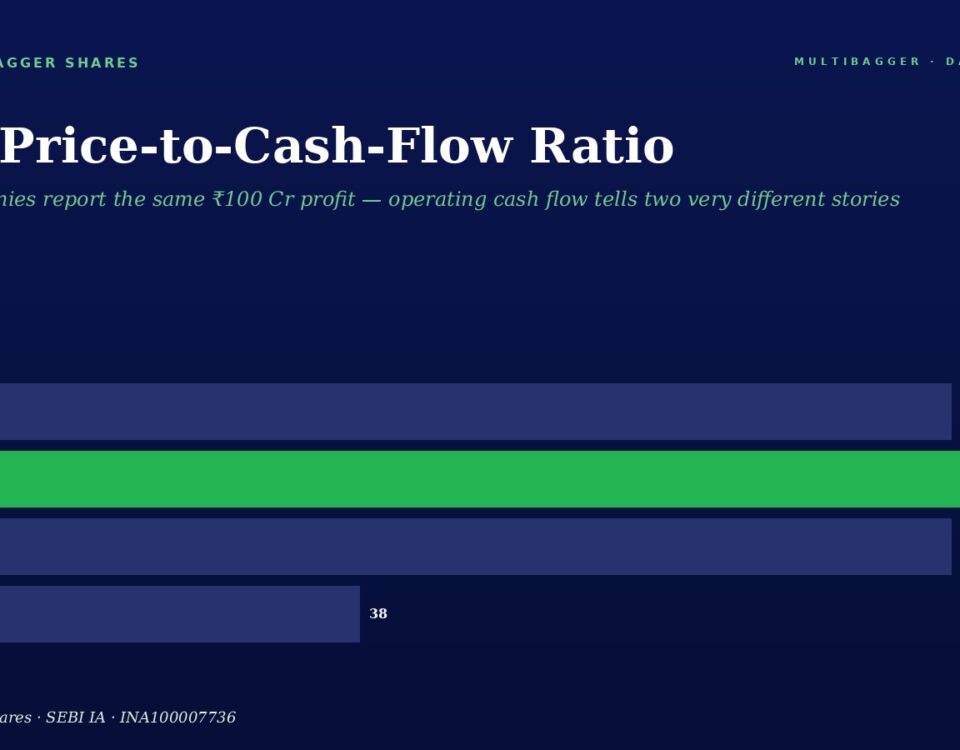
Consider two stylised companies, both reporting the same ₹100 crore of annual profit. The first is a disciplined manufacturer whose receivable days have hovered between 40 and 45 for a decade, whose receivables grow in lockstep with revenue, and whose operating cash flow tracks its operating profit almost exactly. This is a business that sells to customers who want its product enough to pay on time. Its profit is cash, and its growth is self-funding.
The second company shows the same profit, but its receivable days have crept from 45 to 70 to 110 over three years, its receivables are growing at twice the rate of its sales, and its operating cash flow has fallen to a fraction of its reported profit. History offers a long list of cautionary tales — from infrastructure and telecom-equipment firms of the previous decade to several small-cap darlings whose receivables ballooned right before their share prices collapsed — where exactly this pattern preceded a painful de-rating or an outright accounting scandal. The profit was announced; the cash never arrived. By the time the market understood the difference, minority shareholders had already paid the price. The lesson is not that credit sales are bad — they are a normal part of business — but that receivables growing faster than the business itself is a debt the company is quietly extending to its own customers.
Titan Biotech FY25: What the Numbers Reveal
To see what disciplined working-capital management looks like in practice, consider the FY25 audited figures of Titan Biotech Limited (BSE: 524717), a Bhiwadi-based specialty biotechnology company making microbial culture media, peptones, collagen and gelatin for pharmaceutical and biotech customers. This is offered purely as an educational illustration of what healthy fundamentals look like on paper — it is emphatically not a buy, sell or hold recommendation on this or any other security. What makes the company a useful teaching case for receivable days is not the receivables line in isolation but the way the whole balance sheet corroborates the quality of its earnings.
| FY25 Audited Marker | Figure | Why It Matters for Receivables Quality |
|---|---|---|
| Total revenue (FY25) | ~₹214 Cr | The denominator against which receivables are judged. |
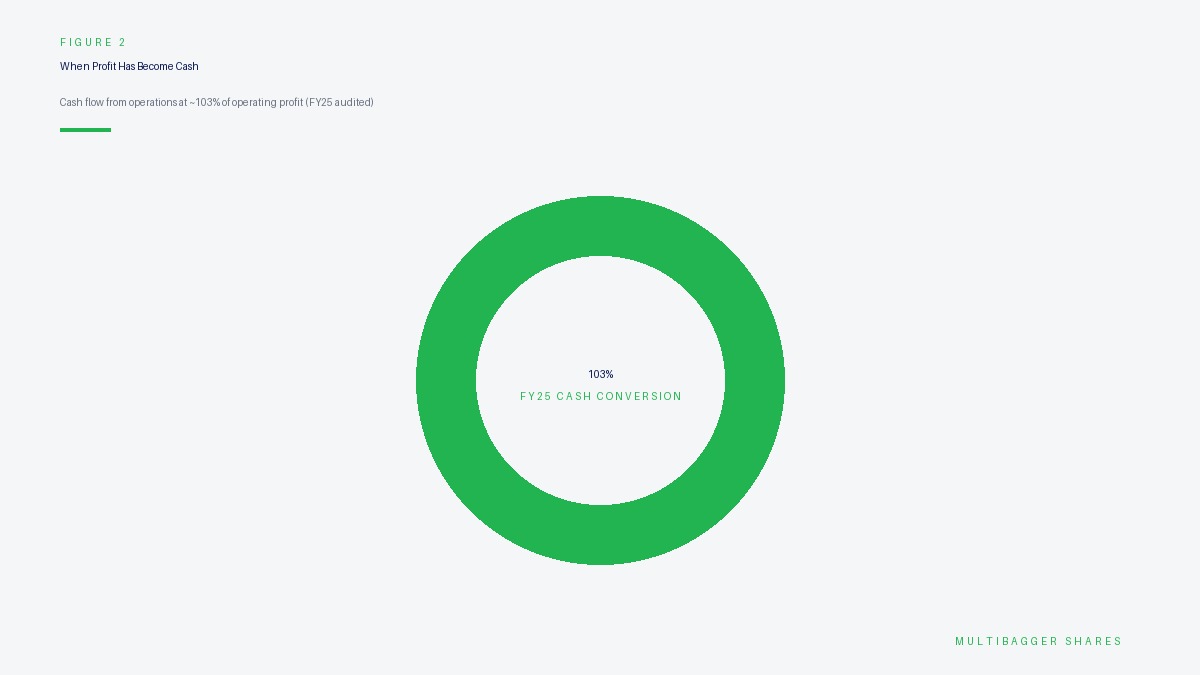
| Cash flow from operations / operating profit | ~103% | Cash generation slightly exceeds operating profit — the clearest proof that sales are being collected, not stuck in receivables. |
| Total borrowings (FY25) | ~₹3 Cr | A business collecting its dues rarely needs debt to fund working capital. |
| Debt-to-equity (FY25) | < 0.05x | Essentially debt-free; self-funded operations. |
| Contingent liabilities (FY25) | ~₹7.78 Cr | Low off-balance-sheet obligations relative to net worth. |
| Exports as % of revenue | ~34.5% | A diversified customer base across 60+ countries lowers single-customer collection risk. |
| Revenue CAGR (10-year) | ~15% | Steady top-line growth, not a one-year spike propped up by credit sales. |
| PAT CAGR (10-year) | ~29% | Profit compounding faster than revenue, consistent with operating discipline. |
Read the table the way an analyst would. The most important line for our purposes is the ratio of cash flow from operations to operating profit, which stood at roughly 103% in FY25. This single figure is the receivable-days lesson in reverse: when a company’s operations throw off slightly more cash than its reported operating profit, it is mathematically difficult for receivables to be silently ballooning, because the cash is visibly arriving. Pair that with borrowings of about ₹3 crore and a debt-to-equity ratio below 0.05 times, and you have a business that is funding its own growth rather than leaning on banks to bridge the gap between booking a sale and getting paid for it.
The export mix of roughly 34.5%, spread across customers in more than sixty countries, adds a further layer of comfort. Concentrated receivables — a company that depends on two or three large domestic buyers — carry the risk that a single customer’s distress can freeze a large slice of the company’s cash. A diversified international book, by contrast, spreads collection risk. None of this tells you anything about whether the stock is cheap or expensive; that is a separate question this article deliberately does not touch. What the numbers do illustrate is the texture of a balance sheet where reported profit and collected cash move together — precisely the quality that a low, stable receivable-days figure is meant to capture.
How Retail Investors Should Use This Metric
You do not need a Bloomberg terminal to run this check. Every listed Indian company publishes its balance sheet and profit-and-loss statement in its annual report and quarterly filings on the BSE and NSE websites, and free screening platforms tabulate the receivables and revenue lines going back a decade. The workflow is straightforward. Pull ten years of trade receivables and ten years of revenue. Compute receivable days for each year. Plot the series and look at the shape of the line, not just the latest value. Then overlay the growth rate of receivables on the growth rate of revenue, and finally cross-check the whole picture against cash flow from operations. Three numbers, one chart, fifteen minutes — and you will have filtered out a meaningful share of the accounting-quality risks that trip up retail portfolios.

Common Traps and Misinterpretations
The first trap is comparing across industries. A construction or capital-goods company will structurally carry far higher receivable days than a consumer-staples firm, and penalising the former for it is simply a category error. Always compare like with like. The second trap is ignoring seasonality: a company with a strong final quarter may show a temporarily elevated year-end receivables figure that unwinds within weeks, so a single balance-sheet date can mislead. Using an average of opening and closing receivables softens this distortion.
The third and most dangerous trap is treating a low number as automatically virtuous. A company can suppress receivable days by aggressively factoring or discounting its invoices — selling its receivables to a financier for immediate cash — which flatters the ratio while quietly incurring a cost that surfaces elsewhere. Read the notes to the accounts for any mention of bill discounting, factoring or securitisation before you celebrate a suspiciously low figure. The final trap is the mirror image: assuming a rising number always signals fraud. Sometimes a company is deliberately extending credit to win a large, creditworthy new customer, and the investment pays off. The ratio tells you where to look; it does not, by itself, deliver a verdict. That is the difference between a screening tool and a conclusion.
Key Takeaways
- Receivable days is a cash-quality test, not just a working-capital ratio. It reveals whether reported profit has actually turned into money in the bank, or is still sitting as an unpaid promise from customers.
- The trend and the comparisons matter more than the absolute number. Judge receivable days against the company’s own ten-year history, its industry peers, and — above all — its own revenue growth rate.
- A near-100% cash-conversion profile is the balance-sheet proof. Titan Biotech’s FY25 audited cash flow from operations at roughly 103% of operating profit, alongside borrowings of about ₹3 crore, illustrates what it looks like when profit and collected cash move together.
- Always cross-check the balance sheet against the cash-flow statement. Rising receivable days combined with operating cash flow lagging profit is one of the earliest and most reliable warning signs in forensic accounting.
Reading receivable days well is not about predicting a share price. It is about judging the honesty and quality of a company’s reported numbers — the unglamorous discipline that, compounded over years, is what actually separates durable wealth creation from expensive lessons.
— Manish Goel / SEBI Registered Investment Advisor (INA100007736)
SEBI Disclaimer: 9 out of 10 individual traders in the equity Futures & Options segment incurred net losses according to a SEBI study. F&O trading is essentially gambling. Focus on quality stock picking and long-term value investing instead. Multibagger Securities Research & Advisory Pvt. Ltd. is a SEBI Registered Investment Advisor (INA100007736). This content is for educational purposes only and is not a buy/sell recommendation on any stock including Titan Biotech Limited (BSE: 524717).