The Quiet Toll: Why a Small Yearly Cost Can Take a Third of What Your Money Earns

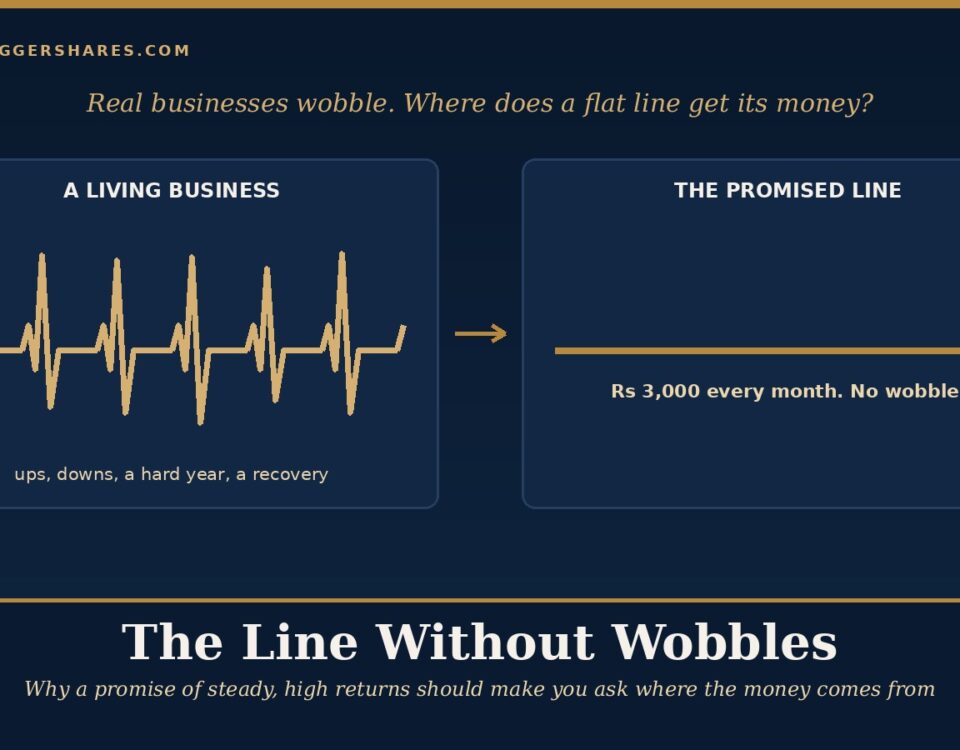
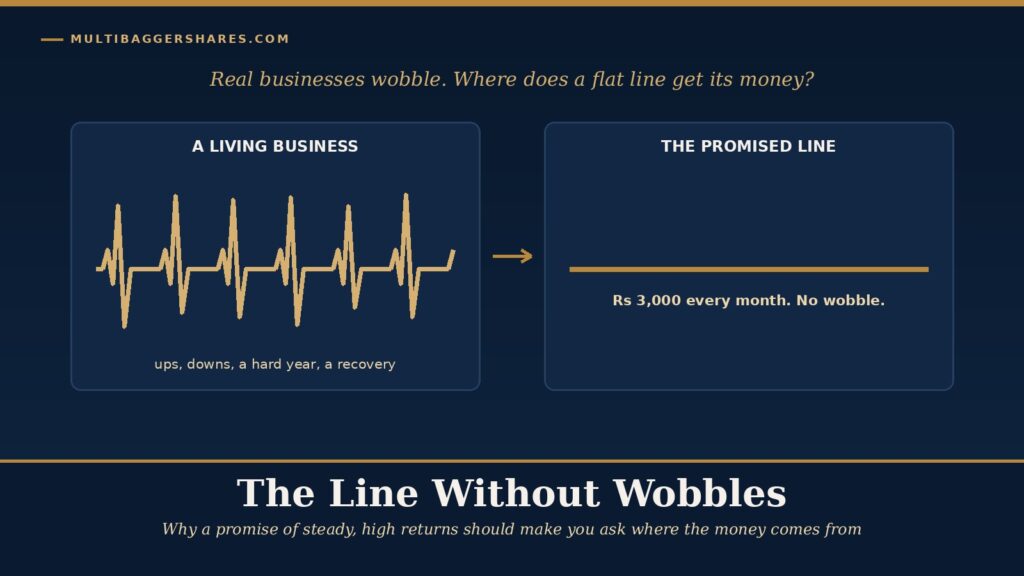
The Line Without Wobbles: Why a Promise of Steady, High Returns Should Make You Ask Where the Money Comes From
November 3, 2026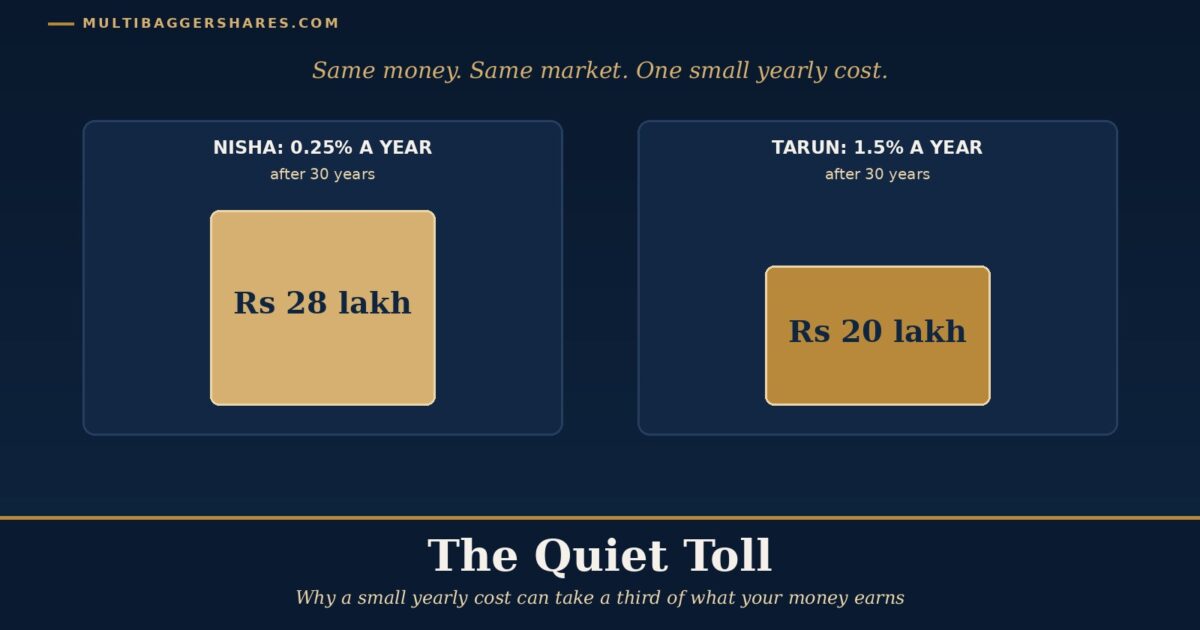
Nisha and Tarun are old school friends. They are in their thirties and each has Rs 1 lakh to put away for retirement. They choose different funds, but the two funds hold much the same kind of businesses. Nisha’s fund charges a yearly cost of Rs 0.25 for every Rs 100 it looks after. Tarun’s charges Rs 1.50. Both friends shrug. After all, what is a rupee and a bit in every hundred? Both people, both funds and all the numbers here are made up for a lesson. The question is simple: thirty years later, does that small gap matter?
It matters a great deal. By the end of this lesson you will see that Tarun ends up with about Rs 8 lakh less than Nisha, from the very same Rs 1 lakh, in the very same market. That is eight times the money he first put in. The reason has nothing to do with skill or luck. It is arithmetic, and the arithmetic is worth understanding, because the cost of investing is one of the few things that is known in advance.
What it really means
Every way of owning shares has a price. If you buy a mutual fund (a pot of money collected from many people and invested together by professionals), the fund charges a yearly fee. This is shown as the expense ratio (the percentage of your money that the fund takes each year to pay for running it). If you trade shares yourself, there are brokerage (the fee a broker charges for each trade), taxes and the gap between buying and selling prices. We will call all of these costs together “the toll”, like the small payment you make at a toll booth on a highway.
Here is the part that surprises most beginners. You never see the toll leaving your account. A fund does not send you a bill. It simply takes its share out of the fund’s value, bit by bit, every day. Your statement shows a smaller gain, and nothing tells you why. Because it is invisible, it is easy to ignore.
There is a second reason the toll is easy to wave away. It is quoted as a small percentage, and small percentages feel small. But a percentage is a share of something that keeps changing. When your pot is Rs 1 lakh, 1.5% is Rs 1,500, about the price of a nice dinner out. When the same pot has grown to Rs 18 lakh, the same 1.5% is Rs 27,000, which is closer to a good second-hand scooter. Nothing about the fee has changed. What changed is how much it is taken from.
Picture a water tank on the roof of your building. Every month, rain and the municipal supply top it up. Now imagine a tiny crack near the bottom that leaks a little every day. On any single day you would never notice. But the water that leaks is water that is no longer in the tank. Next month, there is less water to be topped up, and less again later. The leak does not just take water. It also takes the water that the lost water would have kept collecting.
That last idea has a name: compounding (earning returns on your past returns, like a snowball rolling downhill and picking up more snow as it goes). Compounding is the friend of the patient investor. But compounding does not take sides. It works the same way on costs. A rupee taken as a toll today is a rupee that can never earn returns later, and the returns it would have earned would have earned returns of their own.
A farmer’s field makes the same point. Each year, the farmer keeps some of the harvest as seed for the next sowing. That seed is what makes next year’s harvest bigger. Now suppose a middleman takes a share of the crop every year, before the farmer sets the seed aside. The farmer is not just poorer this year. He has less seed, so a smaller field next year, and a smaller harvest after that. The middleman’s share, repeated for thirty seasons, ends up being much larger than any single year’s cut suggests.
Why it works
Let us put numbers on it. Suppose the businesses that both funds hold grow the money by 12% a year before any costs. This is a made-up round number chosen to keep the sums clean. It is not a forecast, and real markets do not move in a straight line. Suppose also that we ignore tax, to keep the picture simple.
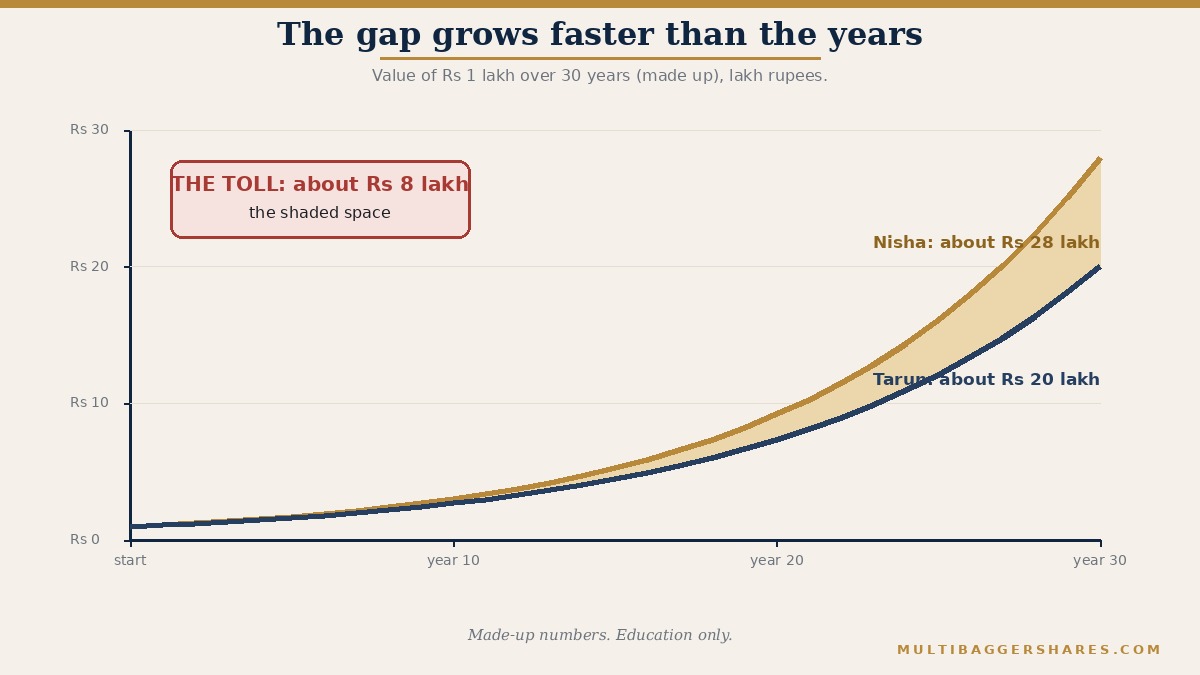
Nisha pays 0.25% a year, so her money grows at about 11.75% a year after costs. Tarun pays 1.5% a year, so his grows at about 10.5%. The difference is only 1.25 percentage points a year. Now watch what happens to the same Rs 1 lakh.
After 10 years Nisha has about Rs 3.04 lakh and Tarun has about Rs 2.71 lakh. A gap of about Rs 33,000. It looks small, and Tarun might say it was not worth a second thought. After 20 years Nisha has about Rs 9.22 lakh and Tarun about Rs 7.37 lakh. The gap is now close to Rs 1.9 lakh, which is nearly twice the money they began with. After 30 years Nisha has about Rs 28.0 lakh and Tarun about Rs 20.0 lakh. The gap is about Rs 8 lakh. Tarun’s final pot is almost 29% smaller than Nisha’s.
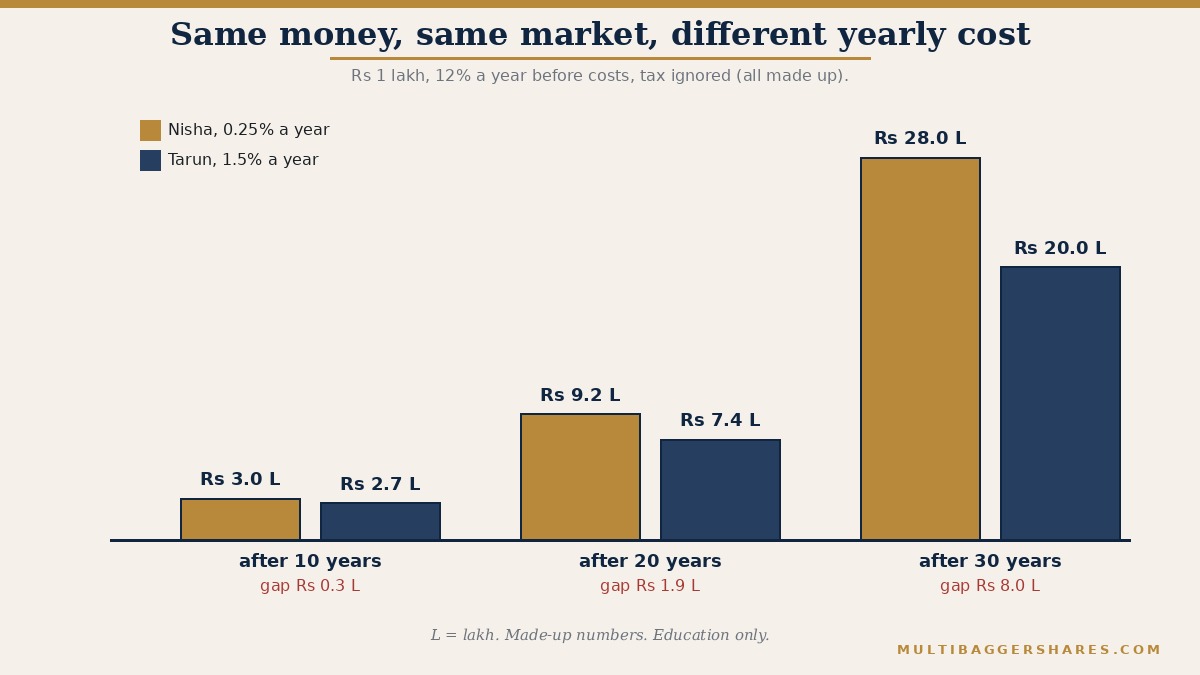
Notice the shape of the gap. It does not grow by the same amount every year. It grows faster each year, because each year the toll is taken from a bigger pot. In his first year Tarun’s cost is Rs 1,500, taken from his Rs 1 lakh. By his thirtieth year the same 1.5% takes about Rs 27,000 in that single year, because the pot has grown to well over Rs 18 lakh. The percentage never changed. The rupees did.
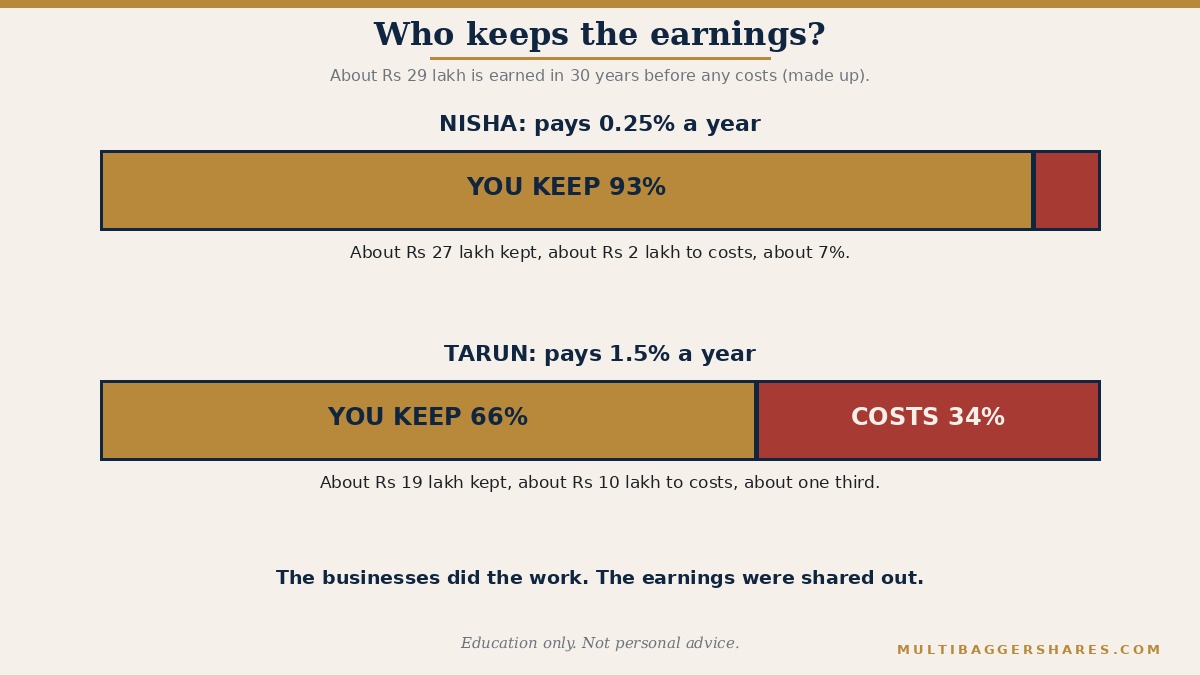
Here is another way to see it, and perhaps the clearest. Before any costs, 12% a year for 30 years turns Rs 1 lakh into about Rs 30 lakh. So the earnings are about Rs 29 lakh. Nisha’s tiny toll takes about Rs 2 lakh of those earnings, which is roughly 7%. Tarun’s toll takes about Rs 10 lakh, which is roughly one third. The businesses did the work. The earnings were shared out. Tarun kept about two parts in three of what his money earned, and the rest went to the toll booth.
This is what John Bogle meant. Bogle founded the Vanguard Group, one of the largest investment firms in the world, and spent his career arguing for low costs. He described the problem as the tyranny of compounding costs (his phrase). The point of his phrase is that costs, like returns, compound. People spend a great deal of effort chasing a few percentage points of extra return. Yet a yearly cost of one or two percentage points is a sure subtraction, taken every single year, whether the markets rise or fall.
One more feature of the toll is worth knowing. It is charged in bad years too. Say the market falls 10% in a year. A fund charging 1.5% would show a fall of about 11.5%, and the investor would then need a slightly bigger recovery to get back to where they started. The cost does not wait for good news. It is the one return in investing that arrives every year without fail, and it arrives for the benefit of someone else.
A real example or two
India has a good everyday example in mutual funds. A fund’s yearly cost can include a commission paid to the distributor (the agent or bank who sold you the fund). In January 2013, direct plans were introduced in India. A direct plan (a version of the same fund bought straight from the fund house, with no distributor commission) has a lower yearly cost than the regular plan of the very same fund. Value Research, the fund-research firm, reported that the gap between the two varies from about 0.05% to 1.5% a year. Same fund, same portfolio, same manager. Only the toll differs.
The rules about what funds may charge have also been moving. From 1 April 2026, as reported by Cafemutual, the Securities and Exchange Board of India (SEBI, the market regulator) brought in a new way of setting the limit. The highest base fee allowed for a smaller open-ended equity scheme (one under Rs 500 crore) was cut from 2.25% to 2.10% a year, with taxes and some other statutory charges moved outside the limit. We mention this only as history. It shows that regulators themselves treat the yearly cost as important. It is not a view on any particular fund.
The same toll shows up when you manage your own shares. Each trade has brokerage and taxes. Someone who trades every week, even with small charges, may find that the costs eat a large share of the profits over many years. This is a reason many long-term investors, from Bogle to Buffett, prefer to buy rarely and hold for long. Fewer trades mean fewer tolls.
How you can use it
The first use is to make the invisible visible. Find out what you are paying. For a fund, the expense ratio is published in the fund’s documents and on the fund house’s website, and it is reported separately for the regular and direct versions. For your own trading, add up the brokerage, taxes and other charges in your statement for a year, and compare the total with your gains.
It also helps to know who gains most from lower costs: the young, and anyone who saves a little every month for decades. Someone who will invest for thirty or forty years gives the toll the longest possible time to compound. A person who needs the money in two years has far less to worry about on this front, because there is little time for the gap to grow. The longer your horizon, the more the toll matters, and that is exactly when it is easiest to ignore.
The second use is a five-question toll check. First, what exactly am I paying, in percent a year, and in rupees on my present pot? Second, what do I get for it? Third, is there a cheaper version of the same thing, such as a direct plan of the same fund? Fourth, how often do I trade, and what does each trade cost me? Fifth, would I still be happy with this cost if the market went nowhere for three years? Because the toll is taken whether or not the market rises.
It is worth being fair here. A low cost does not guarantee a good result, and a higher cost is not always a bad deal. Some people pay for advice, for discipline, for a fund manager with a real edge, or simply for help in staying calm in a crash, and for them the fee may be worth it. The test is whether you know the price and can name what you are getting for it. Another honest limit is that our example used a smooth 12% a year. Real returns are uneven, and the gap in rupees will differ. What does not change is the direction of the arithmetic: the cost is certain and the return is not.
Finally, remember where the real engine sits. Costs only decide how much of the earnings you keep. The earnings themselves come from owning good businesses for a long time. This lesson is not about timing or choosing. It is about keeping more of what your patience has earned.
This article is for education only. Nisha, Tarun and the numbers in their example are made up, and the figures ignore tax. The direct-plan history and the 2026 fee framework are described as background. Nothing here is a forecast, a comment on any fund or business, or a suggestion to buy, sell or switch anything.
Key takeaways
- Every way of owning shares has a toll: fund fees, brokerage, taxes and the price gap on each trade. You never see it leave your account, which is why it is easy to ignore.
- Costs compound just as returns do. In the made-up example, a gap of only 1.25 percentage points a year left one friend with about Rs 8 lakh less after 30 years, from the same Rs 1 lakh.
- The gap grows faster than the years. The same 1.5% was Rs 1,500 in year one and about Rs 27,000 in year thirty, because it is always taken from a bigger pot.
- In India, direct plans (since January 2013) charge less than the regular plans of the same fund. Value Research put the gap at about 0.05% to 1.5% a year.
- Ask five toll questions: what am I paying, what do I get, is there a cheaper version of the same thing, how often do I trade, and would I accept this if markets went nowhere?
— Manish Goel · multibaggershares.com
Manish Goel is a Chartered Accountant and Principal Officer of Multibagger Securities Research & Advisory Pvt. Ltd. (MSRAPL), a SEBI-registered Investment Adviser, Registration No. INA100007736. This content is published by MSRAPL for education only and is not personalized investment advice.
Disclaimer: This article is published by multibaggershares.com for education and general information only. It is not investment advice, investment research, or a recommendation to buy, sell or hold any security. Any companies named are discussed only as illustrative examples. Markets carry risk; please do your own research or consult a qualified professional before making any investment decision. |