The Same Shop, One Year Later: How to Tell Real Growth From Just Opening More Doors

The Understudy: How to Tell Whether a Business Has Prepared for the Day Its Leader Leaves
August 19, 2026
The Revolving Door: What Staff Turnover Quietly Tells You About the Quality of a Business
August 21, 2026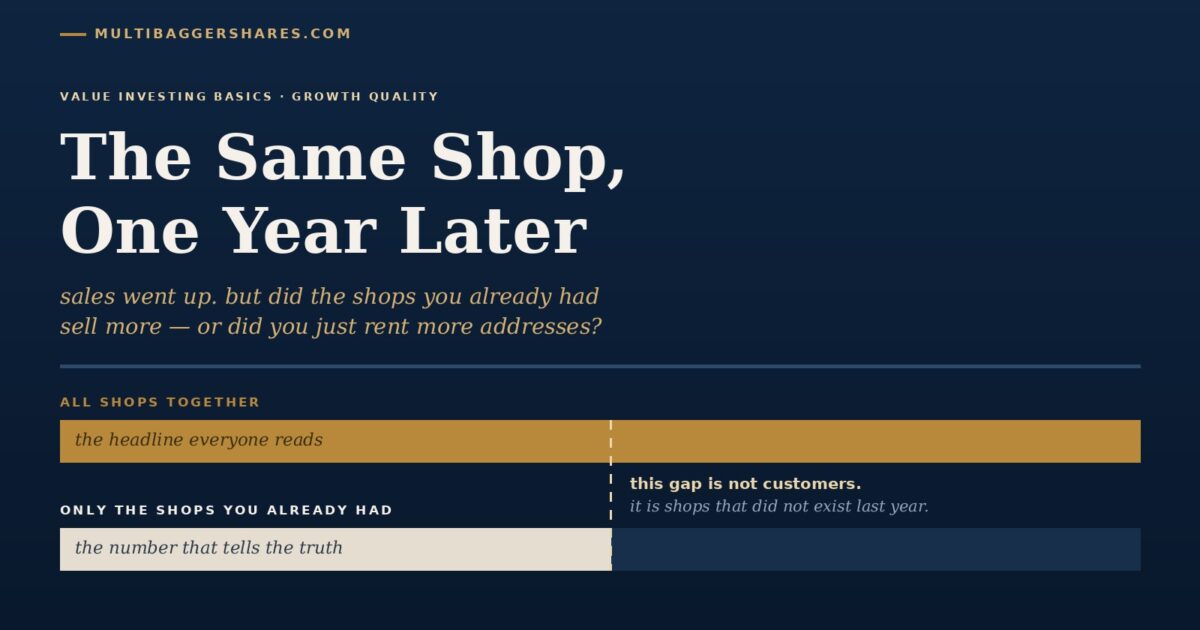
Value Investing Basics
Picture two sweet shops that opened on the same street in the same year. Both began with one
small counter and a glass case. Five years on, both owners will tell you the same happy thing: sales
have gone up. From the pavement, they look like two equally good businesses.
Now walk inside. The first shop is still that one counter at that one address. Five years ago
it sold about twenty lakh rupees of sweets a year. Today it sells fifty. The second owner has opened
four more branches across the city, and all five branches together also sell about fifty lakh. But the
original counter — the one that used to do twenty lakh — now does nine.
Both men can say, honestly and without exaggerating, that their sales have grown. Only one of
them owns a business that is getting better. The other owns a business that is getting bigger while
quietly getting worse, and is paying rent, salaries and security deposits on four extra addresses for
the privilege.
This is one of the most useful distinctions in all of investing, and the headline number hides
it completely. A company that reports higher revenue (the total money a business collects from
customers before any costs are taken out) every year can be doing it in two very different ways: by
selling more from the shops, restaurants or branches it already had, or simply by adding more of them.
Those are not the same achievement. And to their credit, most good companies tell you which is which —
in one line, in a document most beginners never open.
What “same-store sales” actually means
Same-store sales growth answers a single, stubborn question: how much more did the outlets we
already had sell this year, compared with the same outlets last year? Nothing else. New shops are left
out. Shops that shut during the year are left out. What remains is the performance of the base — the
part of the business that has to earn its growth from customers rather than from a chequebook.
You will see the same idea under four or five different names, and they all mean roughly the
same thing. Indian companies usually say like-for-like growth (often shortened to LFL) or same-store
sales growth (SSSG). American filings tend to say comparable store sales, or just comps. Retail
managers say the base. If you meet any of those phrases in an investor presentation, you are looking at
this number.
The mechanics are simple and slightly boring, which is exactly why they work. A store only
counts once it has been open and trading through the whole of both periods being compared. The common
international convention is thirteen full months; several Indian retailers set the bar higher and
count only stores older than two years. Outlets that closed during the year are dropped from both
sides of the comparison. So are outlets that moved, or were enlarged substantially, or were shut for
weeks of renovation — they are put back in only once they have been trading in their new form for the
full qualifying period.
Why be so fussy about excluding new shops? Because a brand-new shop has no previous year to be
compared against. If you let it into the calculation, a company could manufacture growth simply by
spending money, and every chain with access to a bank would look like a wonderful business. What is
left after all the exclusions has a name worth learning: organic growth — growth that comes from the
existing business doing better, rather than from adding new things or buying other companies.
Why one small number does so much work
The first reason is that it is genuinely hard to fake. Opening a shop is easy if you have
capital; anyone with money can rent more addresses. Getting the shop you opened four years ago to sell
more this year than it did last year is a completely different test. It requires that real people came
back more often, or bought more when they came, or told a friend. That is evidence — not an assertion
in a press release — that the product is actually wanted.
The second reason is that it breaks neatly into two honest halves, and companies often tell you
the split. Same-store sales can rise because more bills were rung up (more customers walking in, more
orders placed) or because each bill was bigger (the customer bought more items, or prices went up).
More bills is usually the sturdier kind. Growth that comes only from raising prices can carry on for a
few years and then meet a limit, because customers eventually notice.
The third reason is that it works as an early-warning system, and it fires long before anything
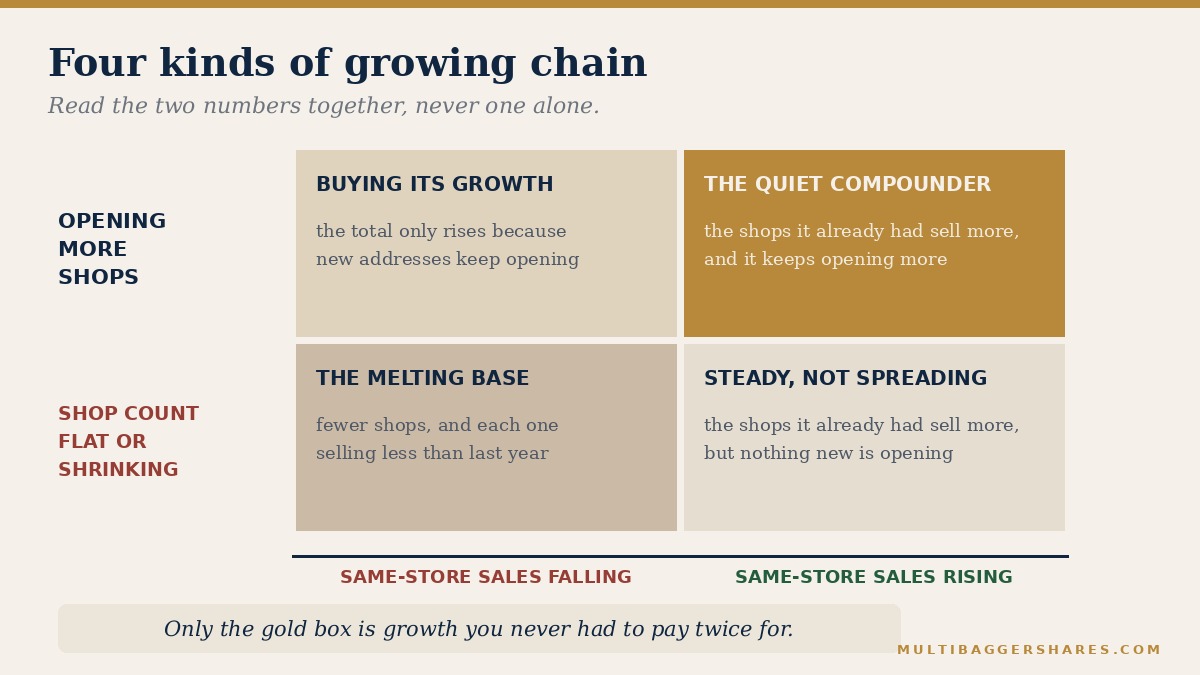
shows up in the headline figures. A chain that keeps opening outlets while its existing outlets sell
less each year is stacking new bricks on a base that is slowly melting. For a while the total still
rises, because the new shops more than cover the decline in the old ones, and the annual report reads
beautifully. Then the openings slow, and the melting is all that is left.
And the fourth reason is that it protects the thing every long-term investor is really relying
on: compounding (earning returns on your past returns — interest on interest, like a snowball rolling
downhill and picking up more snow with every turn). A base that grows by itself compounds. A base that
shrinks while the company buys new addresses does not compound; it treads water at increasing
cost.
Three chains, three different answers
Take a large Indian grocery retailer, Avenue Supermarts, which runs the DMart chain. In the
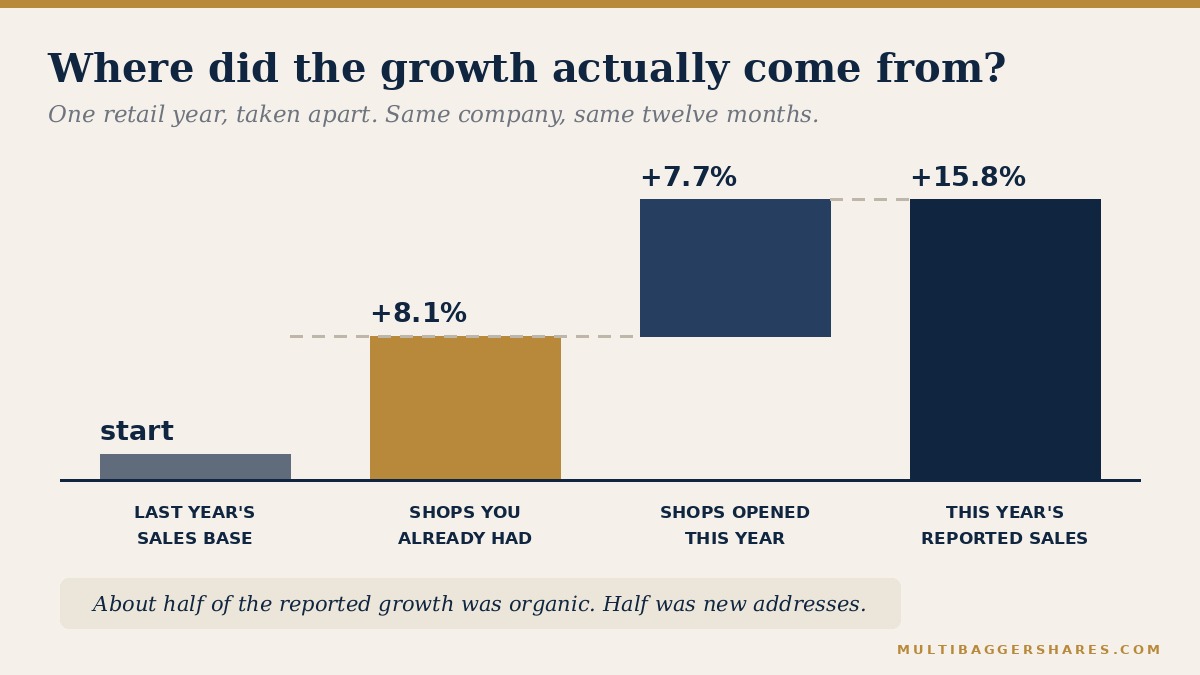
financial year ending March 2026, its total income grew about 15.8 per cent, to roughly ₹67,100 crore.
Over that same year the store count went from 415 to 500 — 85 new stores, about a fifth more addresses
than it started with. And the like-for-like growth of stores older than two years was 8.1 per cent.
Put those side by side and the year explains itself. Roughly half the growth came from shops
that already existed selling more; roughly half came from shops that did not exist a year earlier.
Both engines were running. That is a healthy picture, and it is a far more informative sentence than
“revenue grew 16 per cent.”
There is a second thing in that disclosure, and it is the more interesting one. That 8.1 per
cent compares with 24.2 per cent in the year to March 2023. Same measure, same company, three years
apart, and the number has come down by two-thirds. That is not a scandal — a base of 500 stores simply
cannot grow the way a base of 300 could, and competition has arrived. But it is the sort of trend an
investor would much rather notice for herself, quietly, from a public document, than be told about
years later. Note also what it says about the company: publishing this number faithfully every year,
including in the years when it is falling, is itself a small mark of straight dealing.
Now a second Indian example, from the restaurant business. Jubilant FoodWorks runs Domino’s
in India. In the quarter from January to March 2026, its consolidated revenue was about ₹2,506 crore,
up 19.1 per cent on the same quarter a year earlier — a fine headline by any standard. Like-for-like
growth at Domino’s India in that quarter was 0.2 per cent.
Read those two figures together and the quarter looks entirely different. Almost the whole of
that nineteen per cent came from restaurants that had not been open a year before. The restaurants
that were already there sold very nearly what they had sold twelve months earlier. The company set out
its reasons plainly: it was comparing against a strong 12.1 per cent in the year-ago quarter, the
timing of Ramadan and school examinations fell awkwardly, Navratri had moved into a different quarter,
and temporary cooking-gas supply problems in some markets in March cost an estimated 30 to 40 basis
points (a basis point is one-hundredth of one per cent, so that is between 0.3 and 0.4 per cent).
Are those good reasons? For the full year to March 2026 the same company reported same-store
sales growth of about 5.2 per cent, so one soft quarter sat inside a positive year. That is the useful
habit in miniature: read the quarter inside the year, read the company’s own explanation, then wait
and see whether the explanation ages well. A genuine one-off does not come back. A reason that
reappears in four consecutive years was never a one-off at all.
The third example is a warning, and it comes from outside India. Subway, the sandwich chain,
reached more than 27,000 restaurants in the United States in 2015 — the largest restaurant footprint in
the country. That headline was true, and it was also the least important fact about the business.
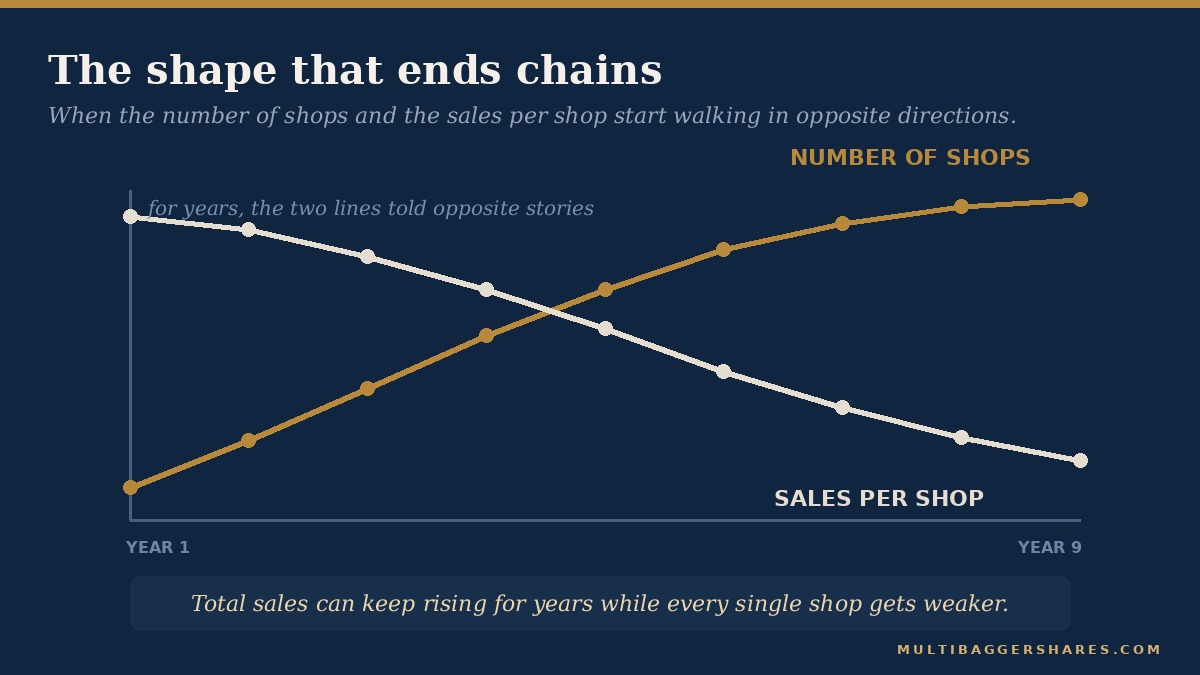
Average sales per restaurant had begun falling after 2012 and then fell for eight consecutive years.
From 2016 onward, franchisees closed more outlets each year than the chain opened. By 2024 the American
count had fallen to 19,502, below twenty thousand for the first time in around two decades, after a net
loss of 631 restaurants in that single year.
For most of a decade, the store count and the per-store number told opposite stories. When two
numbers disagree like that, the smaller and less flattering one usually turns out to be the true one.
Peter Lynch, the American fund manager who ran the Magellan fund and wrote One Up on Wall Street,
described three phases in a growth company’s life: a start-up phase, when it works the kinks out of
the basic business; a rapid expansion phase, when it copies a proven formula into new markets; and a
mature or saturation phase, when there is no easy way left to expand. “The second phase is the
safest, and also where the most money is made,” he wrote. Same-store sales growth is one of the
plainest ways an outsider can tell which of the three phases a chain is really in — regardless of what
the store-opening plan says.
How you can use this, in one afternoon a year
Start by finding the disclosure. It is very rarely in the main financial statements. Look in
the quarterly or annual investor presentation, or the short business update a company files after each
quarter — both usually sit in the Investors section of the company website, and both are also filed
with the stock exchanges. Open the PDF and search it for the words like-for-like, same-store, SSSG or
comparable. If a chain does not publish the number at all, that absence is itself a piece of
information worth writing down.
Then write two numbers next to each other for the same period: total revenue growth, and
same-store growth. The gap between them is, roughly, what the new outlets contributed. Do this for
five years rather than one, on a single sheet of paper. One year is weather; five years is climate. The
pattern to respect is a store count climbing steadily while the same-store line drifts down year after
year — that is the shape that has quietly ended a great many famous chains.
Next, ask what drove the number. Companies frequently split it into volume and price, or into
order count and average order value. Growth led by more customers and more orders is generally
healthier than growth led by charging existing customers more. Both count; they simply do not deserve
the same confidence.
Finally, compare carefully. The most useful comparison is a company against its own history,
because the definition stays constant. Comparing two different companies is harder than it looks: one
may count stores after twelve months and another after twenty-four, one may include online orders in
the base and another may not. Read the small print under the number before you place two of them side
by side, or you will end up comparing a rupee with a rupee and a half.
What this number cannot tell you
It is one instrument on the dashboard, not the verdict. A chain can post excellent same-store
growth and still be a mediocre business — if each new outlet costs a fortune to build and takes years
to repay, or if the expansion is funded by borrowing that the company cannot comfortably service. Good
like-for-like growth is a reason to keep reading, not a reason to stop.
It also only applies where it fits. This test is built for businesses sold from many repeatable
units: retail chains, restaurants, salons, diagnostic labs, cinemas, branch banking, and increasingly
their online equivalents. It has nothing useful to say about a cement plant, a software firm or an
infrastructure developer. Using the right instrument on the wrong business is a way of feeling
informed while learning nothing.
And it is a statement about the quality of a company’s growth, not about what that company
is worth. Nothing here is a view on any share price, and none of the businesses named above is being
recommended or criticised — they are simply three clear, publicly documented illustrations of the same
idea. The purpose of the number is narrower and more durable than a price: it tells you whether the
shops a business already owns are getting better at their job.
Which brings us back to the two sweet shops. If you could ask their owners only one question
before putting your own money into either, you would not ask about total sales, or how many branches
were planned for next year. You would ask the quieter question: what did the original counter sell this
year, compared with last?
Key takeaways
- Rising total sales can mean two very different things — the outlets you already had selling more, or
simply owning more outlets. Only the first is evidence that the business itself is improving. - Same-store sales growth (also called like-for-like growth, comparable sales or SSSG) removes new
openings and closures and reports only what the established base did. - Put total revenue growth and same-store growth side by side for the same period. The gap between
them is roughly the contribution of the new outlets. - Read five years, not one quarter. A store count that keeps climbing while same-store sales keep
falling is the pattern that has ended many famous chains. - Ask whether the growth came from more bills or bigger bills. Growth led by more customers and more
orders is usually sturdier than growth led by higher prices alone.
— Manish Goel · multibaggershares.com
Disclaimer: This article is for educational purposes only and does not constitute financial advice. The author may hold positions in stocks mentioned. Always conduct your own research and consult a SEBI-registered financial advisor before making investment decisions. Stock market investments are subject to market risks. Past performance does not guarantee future returns.