Fifty Per Cent of What? Why Every Growth Number Must Be Read Against Where It Started

The Restaurant That Wanted Everyone: Why a Good Business Chooses What It Will Not Be
November 21, 2026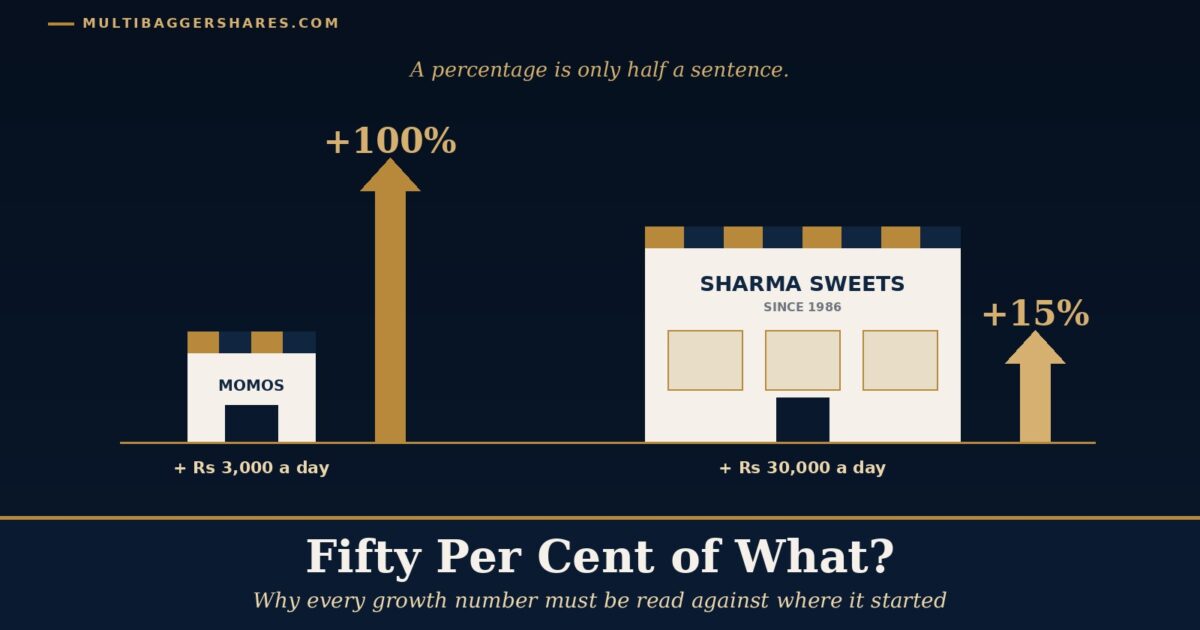
On a busy lane in Lucknow, two shops stand almost side by side. One is a tiny momo stall that Neha started last year with a steamer, a folding table and a lot of courage. The other is Sharma ji’s sweet shop, which his father opened forty years ago. It has glass counters, eight helpers and a queue every evening before Diwali.
One evening, both owners sat down to look back at the year. Neha was delighted. Her daily sales had gone from Rs 3,000 to Rs 6,000. My business has grown 100 per cent, she told her friends. Sharma ji was quieter. His daily sales had gone from Rs 2 lakh to Rs 2.3 lakh. Only 15 per cent, he said, a little disappointed.
Now look again at what actually happened. Neha’s stall brings in Rs 3,000 more every day than it did a year ago. Sharma ji’s shop brings in Rs 30,000 more every day. The shop that grew only 15 per cent added ten times more money than the stall that grew 100 per cent.
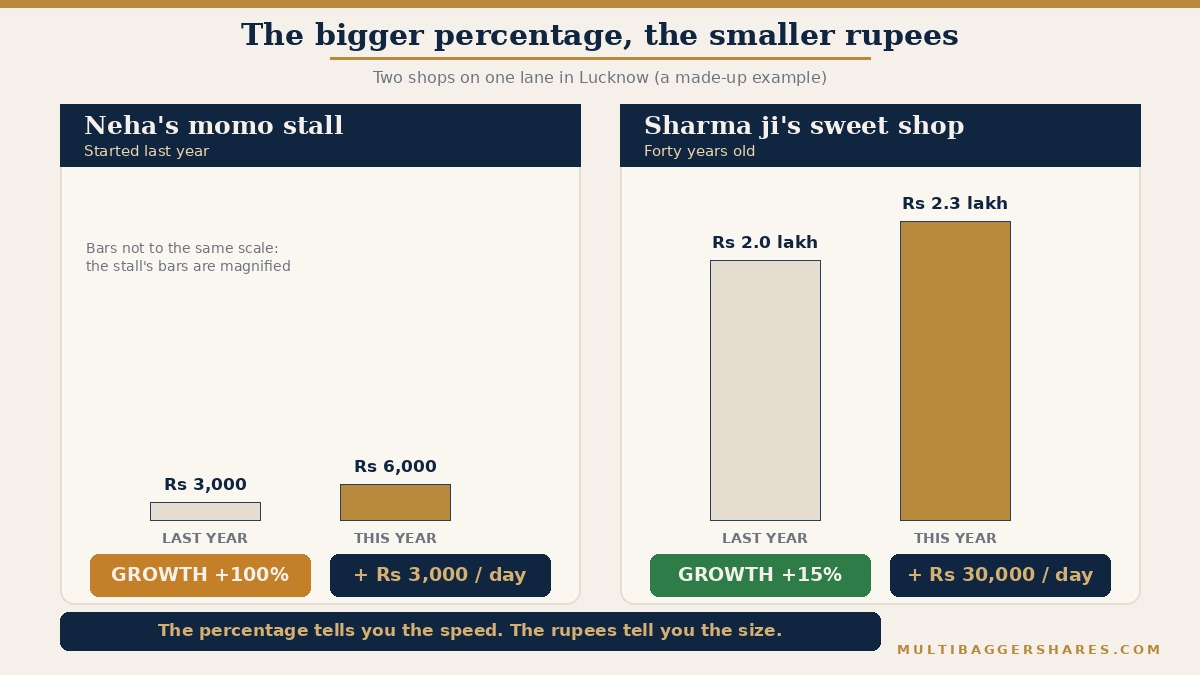
Neither owner was lying. Both percentages are correct. But a percentage on its own hides one simple thing: what it is a percentage of. Before you feel impressed, or worried, by any growth number, it is worth asking one plain question. Fifty per cent of what?
What it really means
A growth percentage compares this year’s number with last year’s number. The number you start from is called the base (the earlier figure that the change is measured against). When people talk about the base effect, they mean that the size of the starting number can make the same change look very big or very small.
Think of two children. A baby who weighs 3 kilos and puts on 3 kilos has doubled in weight: 100 per cent growth. A grown man who weighs 60 kilos and puts on the same 3 kilos has grown by only 5 per cent. Same 3 kilos. Very different percentages. Nobody would say the baby is twenty times healthier than the man. The baby simply started small.
The base effect shows up in three common ways when you read about a business.
A small base makes growth look huge. This is Neha’s stall. When you start from very little, even a modest amount of new business shows up as a giant percentage. A new product that sold Rs 10 lakh last year and Rs 30 lakh this year has tripled. That sounds thrilling. But if the company’s total sales are Rs 1,000 crore, this product is still a tiny part of the story.
A bad year makes the next year look wonderful. Imagine Farhan’s tailoring shop in the old city. In a normal year it earns about Rs 10 lakh. One year, floodwater entered the shop and it stayed shut for months, so it earned only Rs 5 lakh. The next year it reopened and earned Rs 8 lakh. That is 60 per cent growth over the flood year. It sounds like a boom. In fact, Farhan is still 20 per cent below where he was before the flood. He has not grown at all. He is climbing back.
A great year makes the next year look poor. It also works the other way. If a business had a once-in-a-decade year (perhaps a giant one-off order, or a year when a rival’s factory caught fire and its customers came over), the next year will probably look weaker by comparison, even if the business itself is perfectly healthy. A fall from an unusually high base is not always bad news.
The lesson is not that percentages are useless. Percentages are very helpful for comparing things of different sizes. The lesson is that a percentage is only half of a sentence. The other half is the starting number, and you need both halves to understand what happened.
Why it works
Why do growth numbers fool so many people, even experienced ones? There are three simple reasons.
First, our minds love big round percentages. Sales doubled or profit up 300 per cent is easy to remember and exciting to repeat. The starting number is boring, so it is often left out of the headline. A company’s presentation (the slides it shows to investors) may put the percentage in large type and the rupee figure in a small table at the back.
Second, a small base cannot stay small for long. This is the most important point for a long-term investor. A shop that sells Rs 3,000 a day can double easily. A shop that sells Rs 2 lakh a day would have to find Rs 2 lakh of extra sales every single day to double. As a business grows, each new percentage point needs more real customers, more workers, more trucks and more money. So very high growth rates nearly always slow down as the base gets bigger. If you assume that a 100 per cent growth rate from a tiny base will continue for ten years, you are assuming something that almost never happens.
Warren Buffett, the American investor who has run Berkshire Hathaway since 1965, wrote about this in his 1989 letter to shareholders. He explained that when growth starts from a tiny base, very high rates are possible for a while, but once the base balloons, the party ends. He put it in one memorable line: a high growth rate eventually forges its own anchor. He was talking about his own company. Berkshire had grown its net worth (what the business owns minus what it owes) at an average of 23.8 per cent a year starting from $22 million, and he warned that averaging even 15 per cent from a base of $4.9 billion would be much harder.
Third, a rebound is not the same as growth. When a business recovers from a bad year, the growth number measures the recovery, not the progress. Real growth means the business is bigger and better than it was in a normal year. Bouncing back to where you were before is a good thing, but it does not tell you whether the business has truly improved. Investors who mistake a rebound for a new trend often expect the high numbers to continue, and are disappointed when they do not.
A real example or two
Two stories from recent Indian history show the base effect very clearly. They are described here only as lessons in reading numbers. Nothing in them is a comment on any company’s shares.
The record that was really a climb back. In April to June 2020, India was in a strict lockdown. Factories, shops and offices were shut for weeks. The country’s real GDP (the total value of everything produced in the economy, adjusted for price rises) for that quarter fell by 24.4 per cent compared with the year before. One year later, on 31 August 2021, the government’s statistics office announced that GDP in April to June 2021 had grown by 20.1 per cent. Many newspapers called it the highest growth ever recorded.
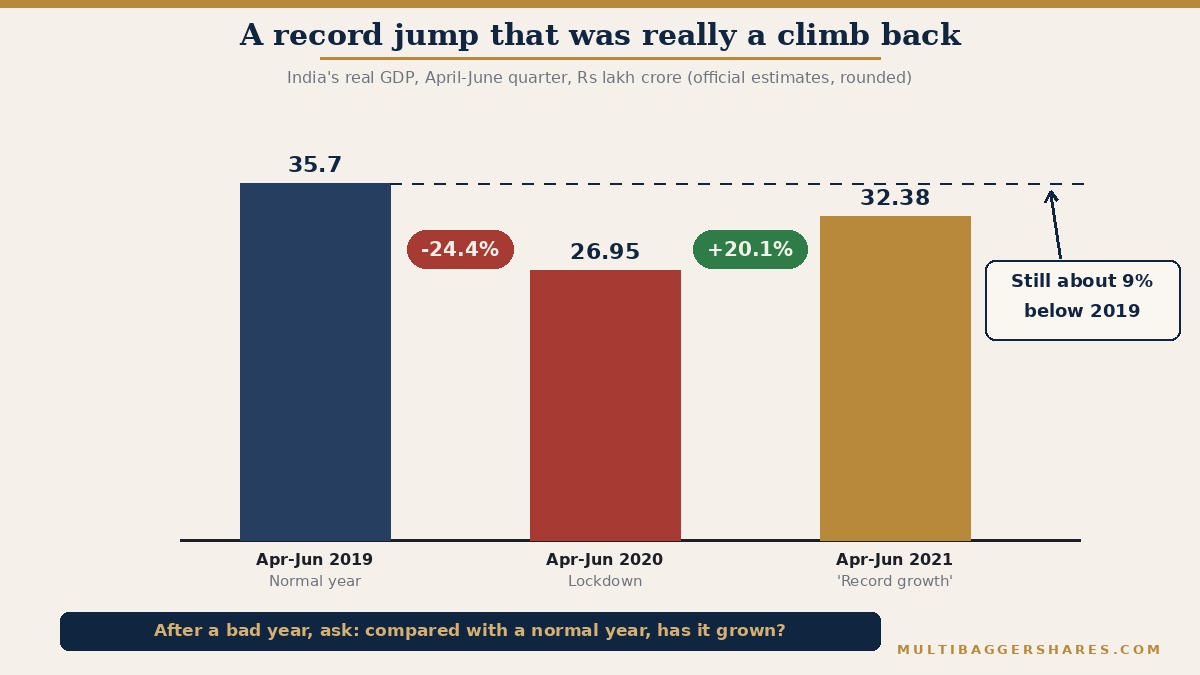
The number was correct. But almost every careful report that day added the same two words: low base. The growth was measured against the lockdown quarter, one of the worst quarters in the country’s history. According to the official figures, real GDP was about Rs 26.95 lakh crore in April to June 2020 and about Rs 32.38 lakh crore in April to June 2021. Two years earlier, in April to June 2019, it had been about Rs 35.7 lakh crore. Economists at rating agencies such as ICRA and India Ratings pointed out that even after the record jump, output was still about 9 per cent below the level of 2019. Like Farhan’s tailoring shop, the economy was climbing back, not racing ahead.
The car company that refused to quote a percentage. In April 2020, Maruti Suzuki, India’s largest car maker, reported something that had never happened before: zero cars sold in the domestic market for the whole month. Its plants were closed in line with government orders during the lockdown. One year later, in April 2021, it sold 1,37,151 cars in India. Growth over zero is not 100 per cent or 1,000 per cent. It cannot be calculated at all.
What the company did next is the useful lesson. In its sales press release for April 2021, it said that comparing with April 2020 would not have any meaning, and it showed comparisons with April 2019 and April 2018 instead, when conditions were normal. That is exactly the right instinct. When last year was not a normal year, the honest thing is to compare with a year that was. As a reader, you can do the same thing for yourself, even when a company does not do it for you.
Notice what both stories have in common. The headline percentage was true, and on its own it was misleading. The truth appeared only when someone asked: compared with what, and was that starting point normal?
How you can use it
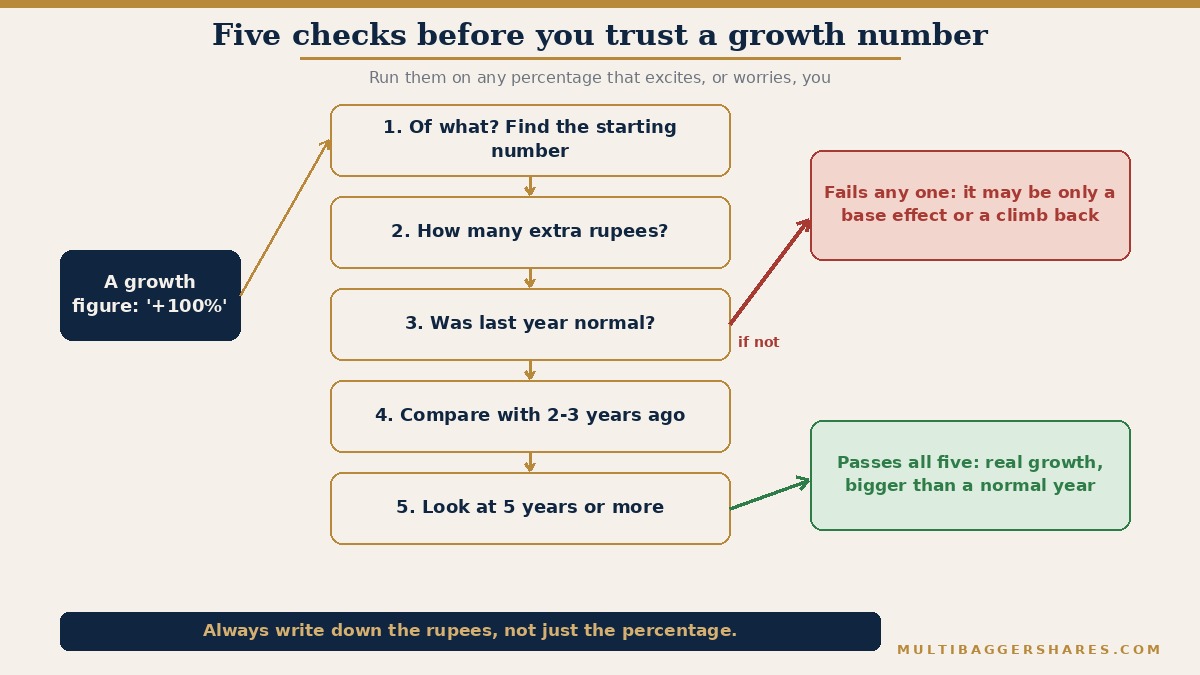
You do not need any special training to protect yourself from the base effect. You need a pencil, a company’s annual report (the yearly book a listed company publishes about its business and results) or its quarterly results, and five simple checks. Run them on any growth figure that excites you.
1. Of what? Find the starting number. If a company says a new product line grew 200 per cent, find out how big that product line was last year and how big it is compared with the whole business. A large percentage of a small number is still a small number.
2. How many extra rupees? Turn the percentage back into money. Sharma ji’s 15 per cent was Rs 30,000 a day. Neha’s 100 per cent was Rs 3,000. Rupees tell you the size of the change. Percentages tell you only the speed.
3. Was last year normal? Ask whether the base year was unusually bad (a strike, a flood, a fire, a lockdown, a lost customer) or unusually good (a one-off order, a rival’s trouble, a price spike). If the base was not normal, the growth number is measuring that unusual year, not the business.
4. Compare with two or three years ago. Like Maruti Suzuki did in its press release, skip over the strange year and compare with a normal one. If the business is bigger than it was two or three years ago, it has truly grown. If it is still smaller, it is recovering, which is good, but different.
5. Look at five years or more. A single year can mislead in either direction. Five or ten years of sales and profit, written in one line, show the real trend. A wonderful business usually shows steady progress across many years, without needing one magical year to look good. You can work out the average yearly growth over the whole period, which smooths out the unusually good and unusually bad years.
One more habit helps a great deal. When you read a company’s quarterly results, write down the actual rupee figures, not just the growth percentages that appear in the news. After a few years, you will have your own simple table, and no headline will be able to surprise you, because you will always know the base.
The same checks protect you from the opposite mistake too. If a good business reports a fall in profit, ask whether last year was an unusually high base before you panic. A dip after a record year is often just the numbers returning to normal.
This is a way to read growth honestly, not a way to predict what any share will do. Neha’s stall may turn into a fine business one day, and Sharma ji’s shop may grow for another forty years. You cannot tell which from one year’s percentage. You can tell a great deal from the rupees, the starting point and the long record. Fifty per cent is a fine number. Just remember to ask: fifty per cent of what?
Key takeaways
- Every growth percentage is half a sentence. Always ask what it is a percentage of: the starting number, or base.
- A small base makes growth look huge, and very high growth rates almost always slow down as the base gets bigger.
- After an unusually bad year, high growth may only be a climb back, as India’s record 20.1 per cent GDP jump in 2021 showed.
- Compare with a normal year two or three years ago, turn percentages into rupees, and look at five years or more.
- This is a way to read numbers and judge business quality. It is education only, not a judgement on any company or share.
— Manish Goel · multibaggershares.com
Manish Goel is a Chartered Accountant and Principal Officer of Multibagger Securities Research & Advisory Pvt. Ltd. (MSRAPL), a SEBI-registered Investment Adviser, Registration No. INA100007736. This content is published by MSRAPL for education only and is not personalized investment advice.
Disclaimer: This article is published by multibaggershares.com for education and general information only. It is not investment advice, investment research, or a recommendation to buy, sell or hold any security. Any companies named are discussed only as illustrative examples. Markets carry risk; please do your own research or consult a qualified professional before making any investment decision. |