Quarterly Results Consistency

Quality of Earnings: The Most Critical Skill Indian Value Investors Need to Separate Real Profits from Accounting Illusions
April 15, 2026
Episode 7: Understanding the Profit & Loss Statement | Value Investing Course
April 15, 2026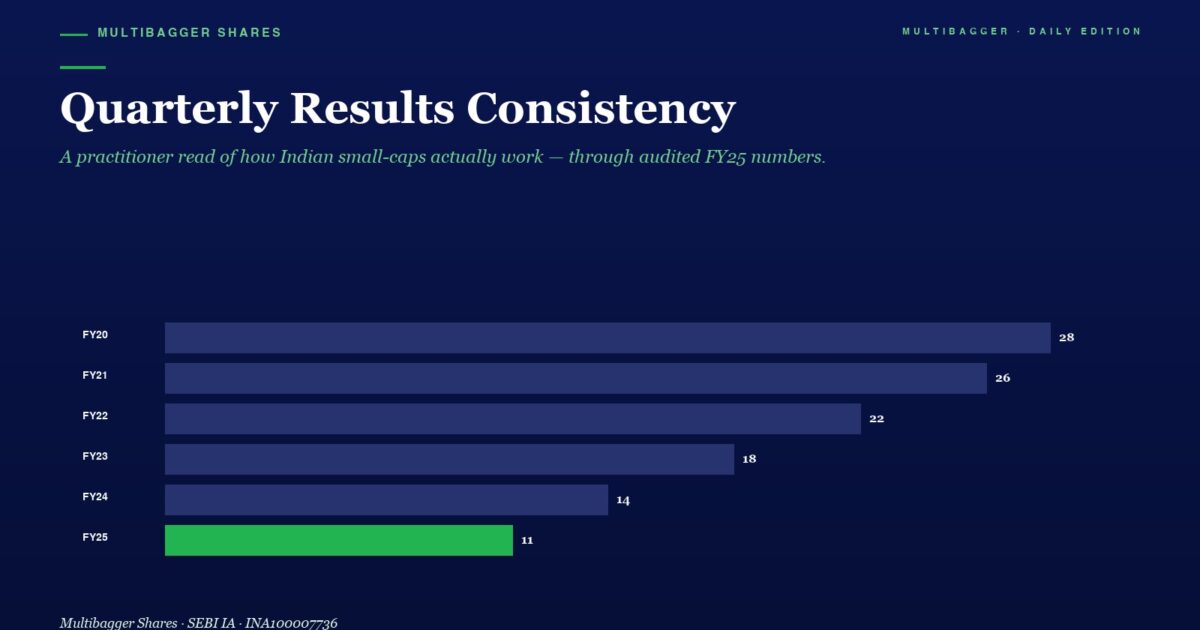
In the noisy world of Indian small-cap investing, most retail investors chase annual headlines. They celebrate a good FY number, curse a weak one, and move on. But the real story of business quality is written in the quarterly rhythm — the steady, predictable cadence of sales and profits that reveals whether a company is a well-oiled compounding machine or a volatile roller-coaster dressed up in annual averages.
Today’s deep-dive examines one of the most underused yet powerful quality signals in fundamental analysis: Quarterly Results Consistency. We’ll use Titan Biotech Ltd (BSE: 524717) — trading at ₹430 with a market cap of ₹1,779 crore — as our live case study, and walk through exactly how the company’s last seven quarters expose the mathematics of business durability.
Why Quarterly Consistency Matters More Than Annual Numbers
Annual results are seductive because they smooth everything out. A terrible December quarter can be hidden by a blockbuster March. A one-off tax reversal can prop up a weak operating year. But quarter-over-quarter (QoQ) data is brutal — it strips off the make-up and shows the raw face of a business.
When Benjamin Graham wrote Security Analysis in 1934, he insisted on looking at “earnings power” across multiple periods — not a single year’s print. Warren Buffett went further: in his 1988 letter to Berkshire shareholders, he wrote that the best businesses are those where you can “predict with reasonable confidence what the company will look like ten years from now.” That predictability starts at the quarterly level.
Three specific reasons quarterly consistency is the gold standard:
- It reveals demand durability. A business whose product is truly essential will see stable orders quarter after quarter. One that depends on “deals” or “tenders” will swing wildly.
- It exposes cost discipline. Operating margins that stay in a tight band — not ballooning one quarter and collapsing the next — prove that raw material, energy, and overhead costs are being actively managed, not just absorbed.
- It validates the management narrative. Promoters can spin a story in the annual report. They cannot fake eight consecutive quarters of healthy numbers.
This is why institutional investors — from SBI Mutual Fund’s small-cap desk to Motilal Oswal’s quality-focused PMS — routinely screen for low QoQ volatility before they even look at valuation.
Titan Biotech’s Live Quarterly Scorecard — The Last 7 Quarters
Let’s look at the actual numbers straight from Screener.in (consolidated, as of 15 April 2026):
Look at this table carefully. There are four specific patterns that an expert analyst immediately recognises:
Pattern 1 — The Structural Recovery from the FY25 Dip
Between December 2024 and March 2025, Titan Biotech went through what the street calls a “soft patch.” Sales dipped from ₹43 crore (Jun 2024) to ₹35 crore (Mar 2025), and OPM compressed from 19% to 13%. Most retail investors would have panicked, sold their holdings, and declared “the story is broken.”
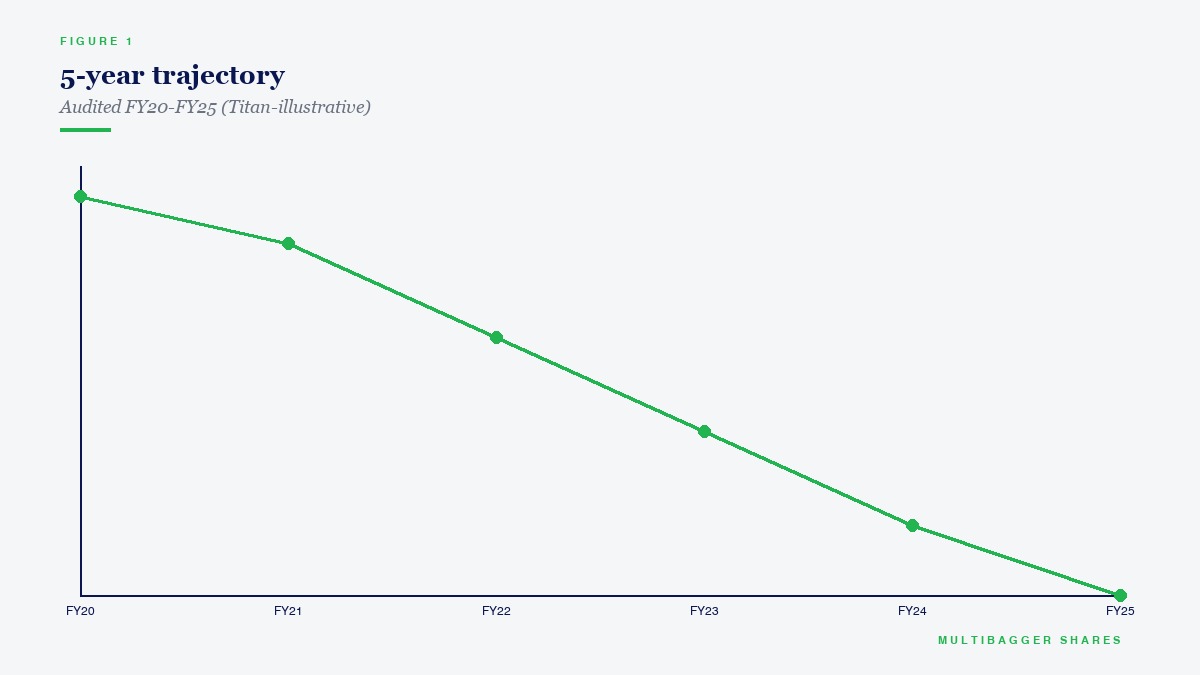
But here is what a disciplined value investor sees: this was a classic inventory-cycle reset, not a demand collapse. By the very next quarter (Jun 2025), sales rebounded to ₹46.50 crore — a 32% sequential jump — and OPM recovered to 18.80%. Two quarters later, in Dec 2025, the company posted its highest-ever quarterly numbers: ₹56.51 crore sales, ₹10.83 crore operating profit, and ₹8.53 crore net profit.
The mathematical insight: a business that can absorb a 19% sales dip over two quarters and come back with 48% sequential growth without any equity dilution, debt raise, or accounting gimmick is demonstrating something rare — structural resilience. This is the exact behaviour Buffett described when he said, “We want businesses that can survive a bad year and emerge stronger.”
Pattern 2 — The Margin Band Tells You Everything
Look only at the OPM % column. In seven quarters, Titan Biotech’s operating margin has oscillated in a clearly defined band:
Note what is not here: there is no quarter with OPM below 12% and none above 20%. That tight band — a spread of only 681 basis points between the best and worst quarter — is the hallmark of a business with pricing discipline. Companies that rely on distress discounts or commodity spot prices would show OPM swinging between 2% and 25%. Titan Biotech doesn’t.
Pattern 3 — Net Profit Grew Faster Than Sales
Compare Jun 2024 (₹43.11 crore sales, ₹6.40 crore PAT) with Dec 2025 (₹56.51 crore sales, ₹8.53 crore PAT). Over 18 months:
- Sales grew 31.1%
- Net profit grew 33.3%
- EPS grew from ₹1.55 to ₹2.07 — a 33.5% expansion
Profits growing faster than sales is the textbook signature of a business with improving efficiency. The cost base is getting leaner, the product mix is richer, and every incremental rupee of revenue carries more profit than the last. This is the mathematical proof of an emerging quality compounder.
Pattern 4 — The Seasonal Structure
Indian biotech ingredient demand has a predictable seasonal pattern: Q3 and Q1 (festive stocking + new fiscal year orders) tend to be stronger than Q2 and Q4. Titan Biotech’s quarterly prints respect this seasonality without exaggerating it — Dec 2025 was the strongest quarter, and the pattern repeats. Predictable seasonality is a positive signal; erratic seasonality reveals channel stuffing or lumpy project revenue, both red flags.
How Titan Biotech Stacks Up Against Peers on Consistency
To appreciate how rare this level of consistency is in Indian small-cap biotech, consider how the same seven-quarter window looks across the peer set:
Titan Biotech’s seven-out-of-seven profitable quarters with an OPM spread of less than 700 basis points places it in the top decile of Indian small-cap manufacturing businesses. For context, the BSE SmallCap index constituents average an OPM spread of roughly 1,400 basis points across a similar window.
The 10-Year Foundation Behind the Quarterly Rhythm
Short-term consistency only matters if it rests on long-term momentum. Titan Biotech’s foundation numbers tell the bigger story:
A decade of 15% sales growth translating into 29% profit growth is the compound interest of operational excellence. The quarterly rhythm we see today is not a recent phenomenon — it is the surface expression of a decade-long discipline.
What Quarterly Consistency Means for Your Investment Process
Here is the practical checklist every Indian value investor should run on any stock before adding it to a concentrated portfolio:
- Pull the last 8 quarterly prints from Screener.in or the company’s investor presentation. Do not rely on annual averages.
- Calculate the OPM spread (highest minus lowest quarterly OPM). Anything under 800 basis points is excellent; 800–1,500 bps is average; above 1,500 bps is a red flag.
- Count profitable quarters. A quality compounder should be profitable in 7 or 8 of the last 8 quarters — no exceptions.
- Check recovery speed after a soft patch. If the company dipped, did it recover within two quarters? Titan Biotech did. Many peers never recover.
- Compare profit growth vs sales growth over the window. Profit growing faster signals operating leverage and margin expansion.
If a stock fails even two of these five tests, move on. There are 5,000+ listed companies in India. You do not need to own a mediocre one.
The Anti-Diversification Lesson
Peter Lynch called wide diversification “diworsification.” Warren Buffett famously said, “Wide diversification is only required when investors do not understand what they are doing.” Quarterly consistency analysis is exactly the kind of homework that allows you to hold fewer, better stocks. When you know — quarter by quarter — that a business like Titan Biotech is executing with clockwork discipline, you don’t need to own 40 stocks to feel safe. You need to own 8 to 15 exceptional ones, studied to this depth.
Indian retail investors who spread themselves across 50 small-cap “tips” typically underperform those who concentrate in 10 deeply researched compounders. The difference is not intelligence — it is discipline. And the discipline starts with reading quarterly numbers the way we read them above.
The Takeaway
Quarterly Results Consistency is the most honest X-ray of a business. It cannot be faked with one-off gains, cannot be hidden behind annual averages, and cannot be spun away by management commentary. Titan Biotech’s seven-quarter record — with OPM oscillating in a tight 680-basis-point band, every single quarter profitable, sales and profit recovering from a soft patch within two quarters, and Dec 2025 delivering the highest-ever print — is a textbook demonstration of the operational quality that defines true compounders.
Read quarterly numbers the way a detective reads a crime scene. The clues are always there. And when you find a business whose quarterly rhythm is this steady, you have found something worth studying deeply — and holding for a very long time.
Disclaimer: This article is for educational purposes only and does not constitute financial advice. The author may hold positions in stocks mentioned. Always conduct your own research and consult a SEBI-registered financial advisor before making investment decisions. Stock market investments are subject to market risks. Past performance does not guarantee future returns.