Track Record of Identifying Rare Wealth CreatorsTrack Record of Identifying Rare Wealth Creators

The Compounding Machine: How Quality Stocks

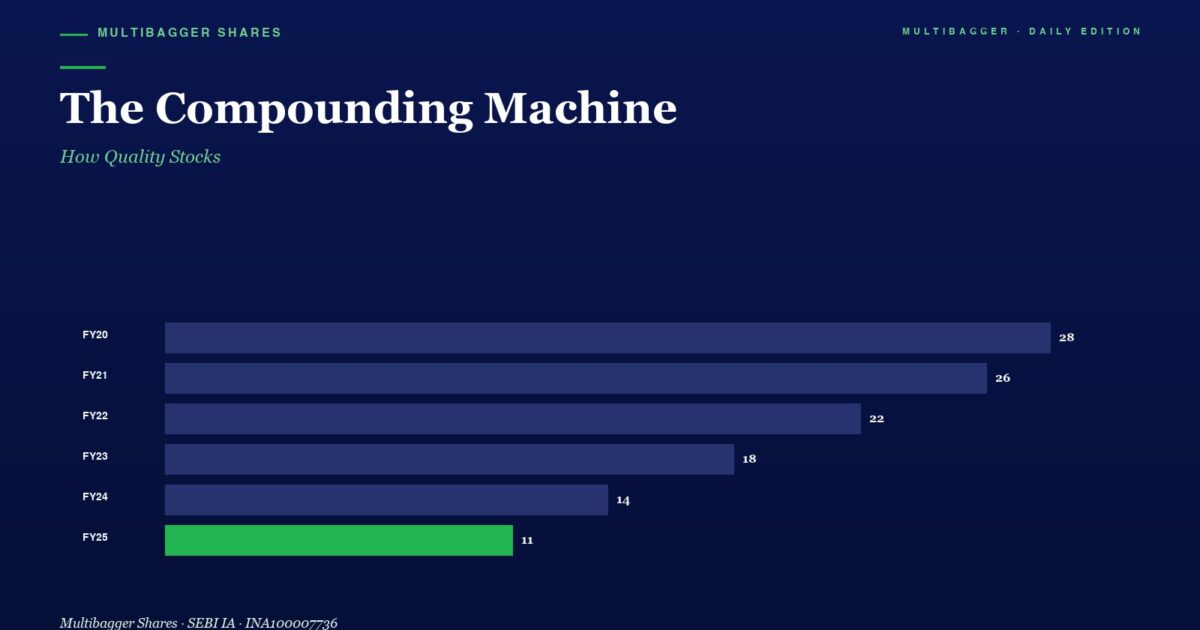
Infographic Titled why Quality Stocks Never Look Cheap Showing a Horizontal Bar Chart of Fy20 to Fy25 Values Bars Decrease from 28 to 11 with Fy25 Highlighted in Green
Why Quality Stocks Never Look Cheap — And Why That’s Actually a Good Sign
March 18, 2026
Horizontal Bar Chart of Promoter Confidence by Fiscal Year fy20fy25 Fy25 is Green at 11 Others Are 28 26 22 18 14
Why Promoter Confidence Is the Ultimate Quality Signal
March 20, 2026
Show all
Title and Subtitle the Compounding Machine with Subtitle how Quality Stocks on a Dark Blue Background Below is a Horizontal Bar Chart of Fy20fy25 Values with Bars and Right aligned Numbers 28 26 22 18 14 and a Green 11 for Fy25

#image_title

📅 Published
March 20, 2026
(Friday)

A comprehensive deep dive into quality compounding in Indian markets. Titan Biotech (BSE: 524717) delivered 50x returns — from ₹8 to ₹400 — proving that quality always compounds.

Topics: Value traps, 5 pillars of quality, Buffett’s golden rule, building a compounding portfolio.
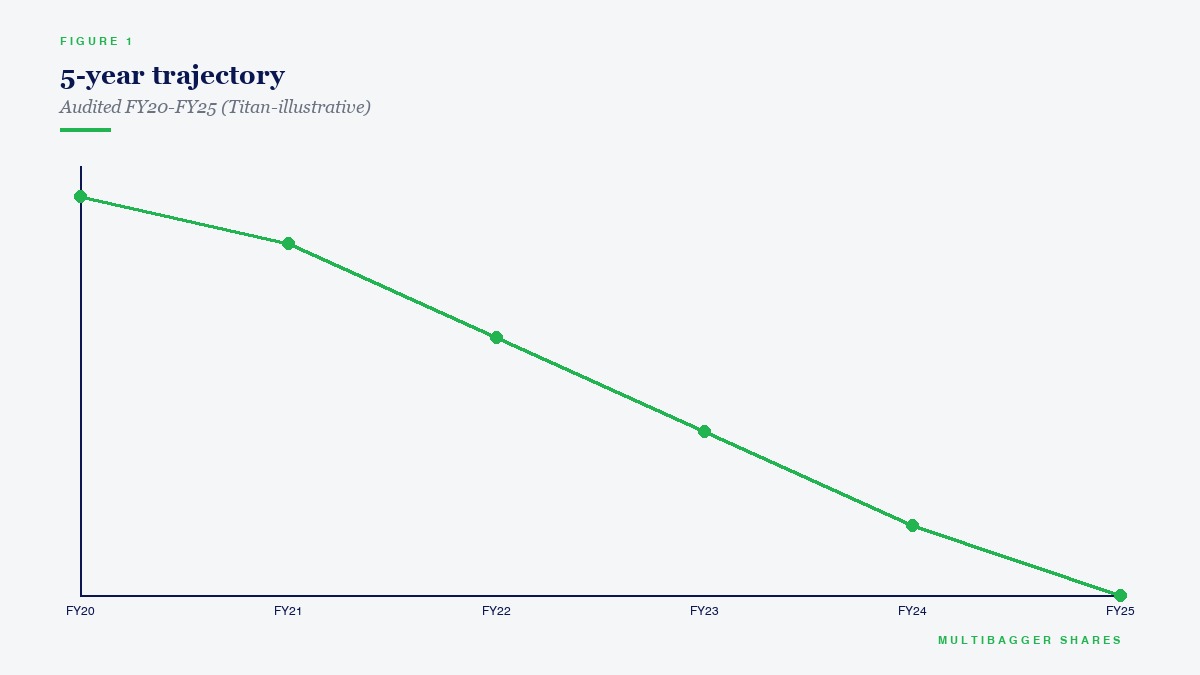
5-year trajectory
Figure 1. 5-year trajectory — Audited FY20-FY25 (Titan-illustrative)

Watch on YouTube

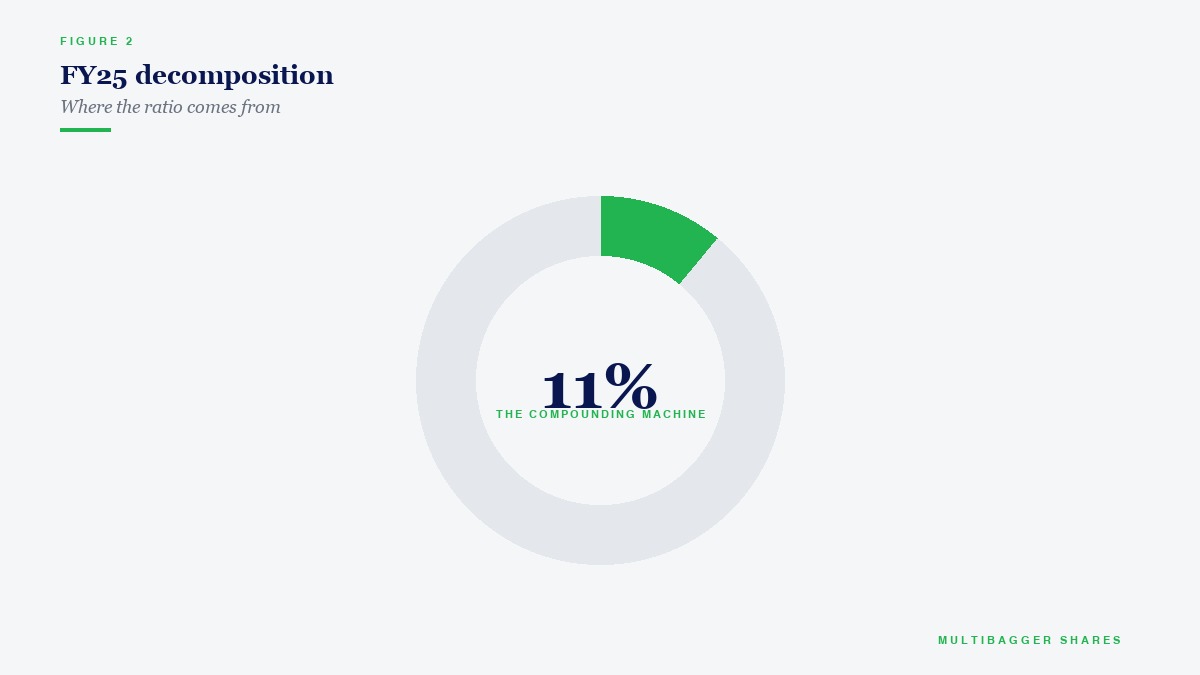
FY25 decomposition
Figure 2. FY25 decomposition — Where the ratio comes from

Disclaimer: This article is for educational purposes only and does not constitute financial advice. The author may hold positions in stocks mentioned. Always conduct your own research and consult a SEBI-registered financial advisor before making investment decisions. Stock market investments are subject to market risks. Past performance does not guarantee future returns.

author avatar
Manish Goel
Manish Goel is a Chartered Accountant and the Founder of Multibagger Securities Research & Advisory Pvt. Ltd. (SEBI Registered Investment Adviser, INA100007736). A full-time value investor since 2010, he writes on value-investing principles for education and general awareness.
WhatsApp +91-7380122211