EPS Growth Track Record

Charlie Munger’s Mental Models: How the Greatest Investment Mind Used Multi-Disciplinary Thinking to Build a $2.6 Billion Fortune — The Complete Latticework Framework Every Indian Investor Must Master
April 7, 2026
The Gordon Growth Model: The Elegant Valuation Formula That Tells You the True Worth of Any Dividend-Paying Stock — How Indian Investors Can Use This Timeless Method to Find Undervalued Compounders Before the Market Catches On
April 7, 2026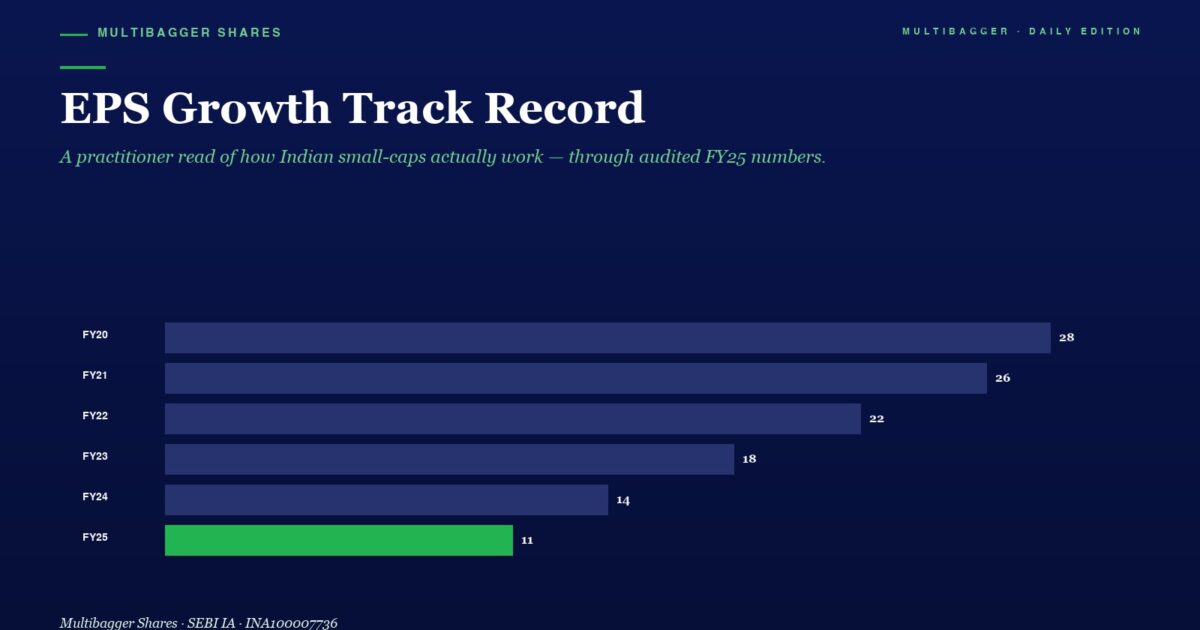
Every Indian investor has heard the phrase “invest in quality companies.” But what does “quality” actually mean in numbers? The answer lies in one of the most powerful — yet most underused — fundamental metrics in value investing: Earnings Per Share (EPS) growth track record.
Today, we deep-dive into the EPS growth story of Titan Biotech Ltd (BSE: 524717) — a quiet compounder that has grown its earnings per share from ₹0.42 in FY2015 to ₹5.21 in FY2025, a 12.4x multiplication representing a 10-year EPS CAGR of 28.6%. We will decode why this matters, what it reveals about the business, and how you can use EPS growth analysis to find the next multibagger hiding in plain sight.
Why EPS Growth Is the Most Important Number in Investing
Warren Buffett has said it best: “In the long run, stock prices follow earnings.” This is not just an aphorism — it is the foundational truth of markets.
When a company grows its earnings per share consistently over many years, the stock price has no choice but to follow. This is because a stock is ultimately a fractional ownership of a business, and the value of that ownership is determined by what the business earns for its owners.
Peter Lynch built a legendary fortune by seeking companies where EPS grew consistently at 20-30% annually. Benjamin Graham called EPS stability the single most important screening criterion for a safe stock. And in India, every multibagger story — from Infosys to Asian Paints to Titan Company — shares one common thread: decades of consistent EPS compounding.
EPS growth is powerful for three reasons:
- First, it is the engine of long-term wealth creation. When a company doubles its EPS over five years, the underlying business value doubles. Sustained EPS growth is what separates genuine wealth creators from one-hit wonders. Companies that compound earnings year after year are building real economic value for shareholders.
- Second, it filters out accounting manipulation. Revenue can be inflated with aggressive recognition policies. Operating profit can be manipulated with depreciation choices. But EPS, especially when cross-verified with cash flows, is the bottom line that matters to shareholders. A company that grows EPS consistently year after year, backed by real cash flows, is very difficult to fake.
- Third, it reveals the durability of competitive advantages. Any company can have one great year. Only businesses with genuine moats — pricing power, customer captivity, low-cost production, or unique technology — can grow earnings per share at above-average rates for an entire decade.
Titan Biotech’s 10-Year EPS Journey: The Data Speaks
Let us look at the exact numbers. All figures are sourced from Screener.in (consolidated, adjusted for corporate actions):
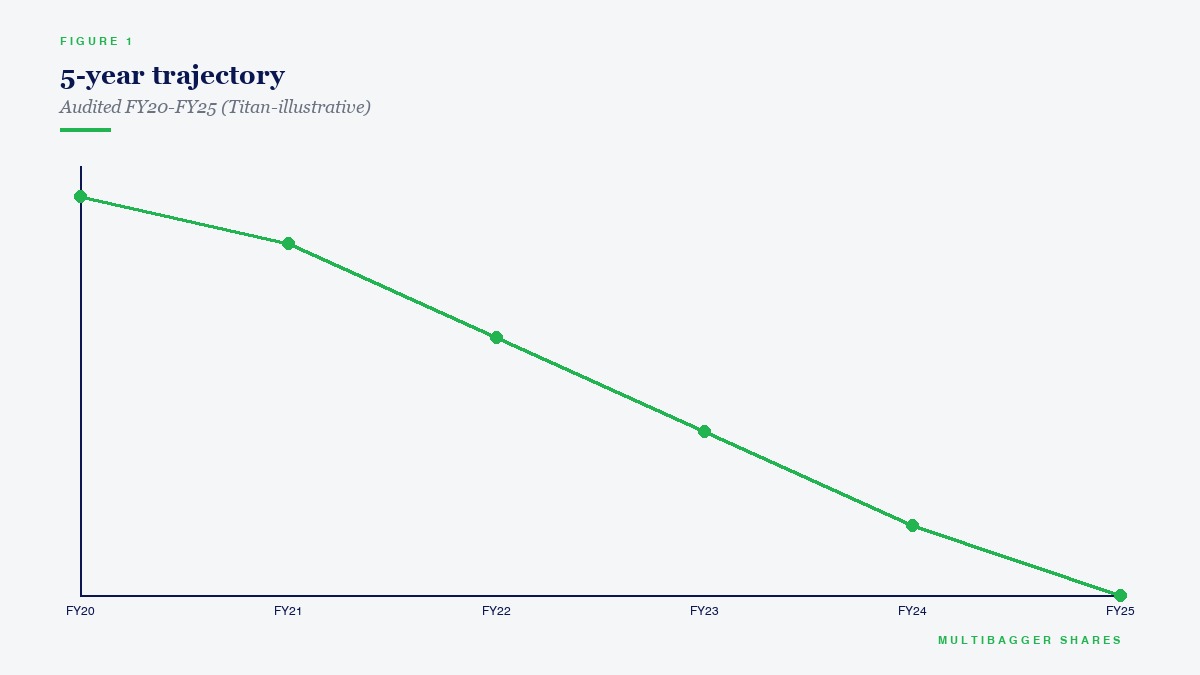
- 10-Year EPS CAGR (FY2015–FY2025): 28.6%
The EPS has grown 12.4 times in a decade, from ₹0.42 to ₹5.21.
At a glance, three distinct phases emerge:
- Phase 1 — The Foundation Years (FY2015–FY2019): EPS grew steadily from ₹0.42 to ₹0.85, a 2x growth in four years. This was the period when Titan Biotech was quietly building its manufacturing capabilities, expanding its product range in gelatin and peptones, and entering new export markets. Growth was moderate but consistent — exactly what a quality compounder looks like in its early phase.
- Phase 2 — The Inflection Point (FY2020–FY2021): EPS exploded from ₹1.71 to ₹7.35 — a 4.3x jump in a single year. FY2021 coincided with the COVID-19 pandemic, when global demand for biotech ingredients, culture media, and pharmaceutical-grade gelatin surged dramatically. Titan Biotech’s specialized product portfolio found itself at the center of a global supply crunch. Revenue jumped from ₹79 Crore to ₹142 Crore while profit margins expanded sharply.
- Phase 3 — Post-Peak Consolidation (FY2022–FY2025): EPS settled into the ₹5–6 range. Investors who focus only on the recent EPS trajectory might be concerned — after all, FY2025 EPS of ₹5.21 is below FY2021’s ₹7.35. But this interpretation misses the forest for the trees. The correct comparison is not FY2021 (an extraordinary pandemic year) versus FY2025 — it is FY2015 versus FY2025. And over that full decade, the compounding has been extraordinary.
- The critical insight: Titan Biotech’s base EPS has permanently “step-changed” higher. The company went from earning ₹0.42 per share in FY2015 to a new earnings plateau of ₹5–7 per share. This kind of step-change is the hallmark of a business that has genuinely scaled — not one that benefited from a one-time event.
The Early Signals of FY2026: A New Step-Change Approaching?
Here is where the story gets even more compelling. In Q3 FY2026 (quarter ending December 2025), Titan Biotech reported:
– Net Profit: ₹8.53 Crore — up 94.31% year-on-year
– Revenue: ₹56.51 Crore — up significantly from ₹36.55 Crore in Q1 FY26
Revenue has risen for four consecutive quarters. The trajectory suggests that FY2026 may mark the beginning of a third step-change in Titan Biotech’s EPS — from the ₹5–6 range to potentially ₹8–10+.
If the company sustains this momentum, the 10-year EPS CAGR, measured from FY2015 to FY2026, could exceed 30%.
Peer Comparison: EPS Growth vs. Closest Competitors
A single data point means nothing without context. Let us compare Titan Biotech’s EPS growth to its closest peers in the specialty biotech ingredients and gelatin space:
The numbers reveal something interesting. Nitta Gelatin shows a higher 5-year EPS CAGR, but this is largely because it was recovering from depressed earnings — its 10-year trajectory is far less impressive. More importantly, Nitta Gelatin’s revenue CAGR is only 9.26% over five years, indicating that its profit growth is largely cost-driven rather than revenue-led. In contrast, Titan Biotech’s earnings growth is backed by genuine revenue expansion — a qualitatively superior growth story.
What Consistent EPS Growth Tells You About the Business Quality
A company that grows EPS at 28.6% CAGR for a decade is telling you something fundamental about its competitive position. This is not luck — it is evidence of structural advantages:
- Pricing Power: To grow earnings faster than costs for a decade, a company must have some ability to pass through price increases. Titan Biotech’s specialized products — pharmaceutical-grade gelatin, peptone culture media, collagen peptides — serve customers who prioritize quality and consistency over price. Switching costs are high in pharmaceutical-grade ingredients.
- Operational Scalability: Look at how operating margins expanded as the business scaled. In FY2015, the company operated on thin margins. By FY2021–2024, operating profit margins had expanded significantly. This is operating leverage at work — a fixed-cost base spreading over a growing revenue base. Companies with true operating leverage deliver EPS growth faster than revenue growth, exactly what we see here.
- Clean Accounting: The EPS growth at Titan Biotech is backed by real cash flow generation. Operating Cash Flow validates reported profits quarter after quarter. This is not accounting-driven earnings manipulation — this is genuine wealth creation.
The Concentrated Portfolio Lesson: Why This Matters More Than Diversification
Here is the truth that most financial advisors will never tell you: If you had held Titan Biotech for the last ten years — even with its EPS volatility — you would have participated in a 28.6% annual earnings compounding story.
Warren Buffett put it best: “Wide diversification is only required when investors do not understand what they are doing.” Peter Lynch called excessive diversification “di-worse-ification” — spreading capital across 30–50 stocks guarantees mediocre, index-like returns.
The case for concentrated investing in quality compounders like Titan Biotech is built on exactly this EPS analysis. If you had spent time understanding the business deeply — studying its EPS trajectory, its product moats, its export growth — you would have had the conviction to hold through FY2022’s earnings dip (when EPS fell from ₹7.35 to ₹5.25) and emerge on the other side with a compounded fortune.
A portfolio of 8–12 deeply researched quality compounders, where each holding has a 20%+ EPS CAGR story, will consistently outperform any diversified portfolio of 40 stocks over a decade. This is not an opinion. It is arithmetic.
How to Track EPS Growth for Any Indian Stock: Your Step-by-Step Framework
Here is the practical framework that Manish Goel teaches value investors at multibaggershares.com:
- Step 1: Pull 10 years of EPS data from Screener.in (use the consolidated view). Calculate the CAGR using: CAGR = (Latest EPS / Base EPS)^(1/n) − 1
- Step 2: Identify the trend — is EPS growing steadily, or are there sharp spikes and dips? Steady growth is better. Spike-then-collapse patterns may indicate cyclicality.
- Step 3: Compare EPS CAGR to Revenue CAGR. EPS growing faster than revenue suggests expanding margins and operating leverage — a green flag. EPS growing slower than revenue suggests margin compression — a yellow flag.
- Step 4: Verify with Operating Cash Flow. If OCF per share tracks EPS growth, the earnings are real. If EPS rises but OCF stagnates, investigate.
- Step 5: Estimate forward EPS using recent quarterly run-rates and historical growth trends. Compare the forward EPS growth rate to the company’s historical average to assess whether growth is accelerating, stable, or decelerating.
- Step 6: Cross-check EPS growth with balance sheet strength (debt levels, cash reserves) and cash flow quality. A company with 20%+ EPS CAGR backed by strong cash flows and low debt is a fundamentally superior business.
Conclusion: 28.6% EPS CAGR Is Not an Accident
In the Indian stock market, where thousands of companies exist, very few can demonstrate a 28.6% EPS CAGR over ten years. Titan Biotech is one of them. This track record is not chance — it is the mathematical output of a business with pricing power, operational scalability, clean accounting, and management that allocates capital wisely.
Patient, focused investors who understand the EPS story can appreciate the fundamental quality of this business. When you own a company whose earnings compound at 28.6% annually, the business itself is doing the heavy lifting of wealth creation.
For value investors who believe in the power of concentrated portfolios and deep research, Titan Biotech’s EPS growth track record is a masterclass in what a quality compounder looks like — in numbers.
Disclaimer: This article is for educational purposes only and does not constitute financial advice. The author may hold positions in stocks mentioned. Always conduct your own research and consult a SEBI-registered financial advisor before making investment decisions. Stock market investments are subject to market risks. Past performance does not guarantee future returns.