The Cracking Whip: Why a Small Wobble in Shop Sales Becomes a Big Swing at the Factory

The Angry Neighbour: Why a Business Needs the Goodwill of the People Around It, Not Just a Licence on Paper
November 16, 2026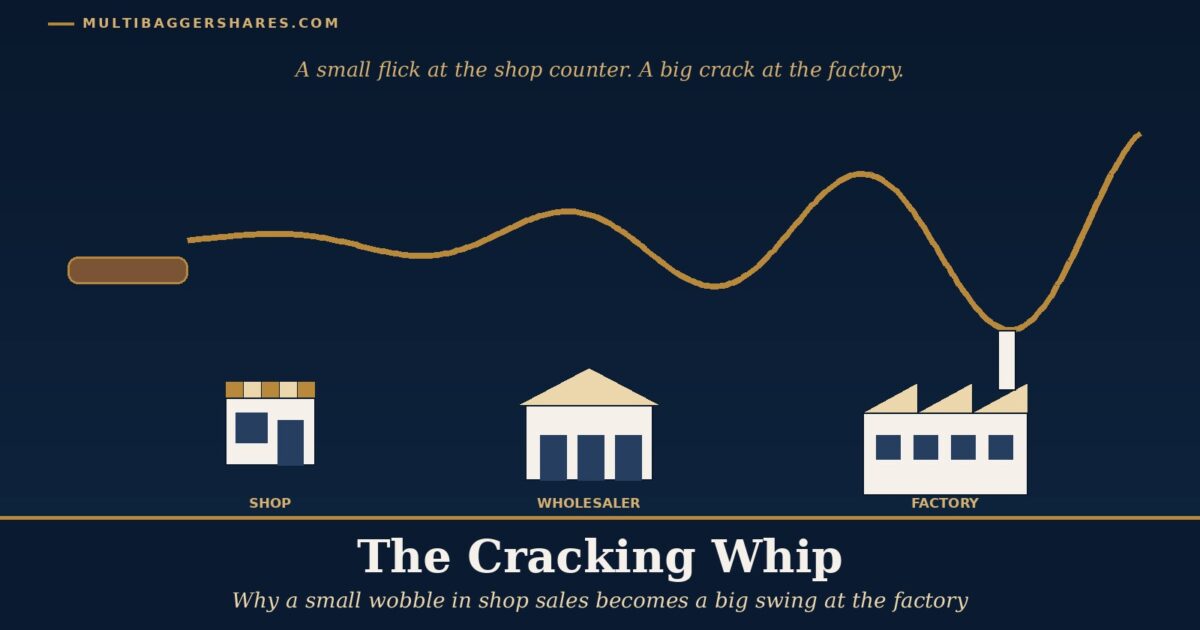
One hot April, a fan shop in Lucknow called Gupta Electricals has a busy week. The heat comes early, and instead of the usual 100 fans, the shop sells 120. Mr Gupta is pleased, but he is also worried. What if the heat lasts? What if the wholesaler runs out? So when he places his next order, he does not just ask for 120 fans to refill his shelf. He asks for 200, to be safe.
The wholesaler in the city supplies forty shops. Many of them had the same hot week, and many of them did the same thing as Mr Gupta. Suddenly orders are pouring in. The wholesaler thinks the whole summer will be huge, so he orders three times his normal amount from the fan factory. The factory, seeing orders it has never seen before, asks its parts maker for five times the usual number of motors and copper coils. It even talks about hiring more workers and buying a new machine.
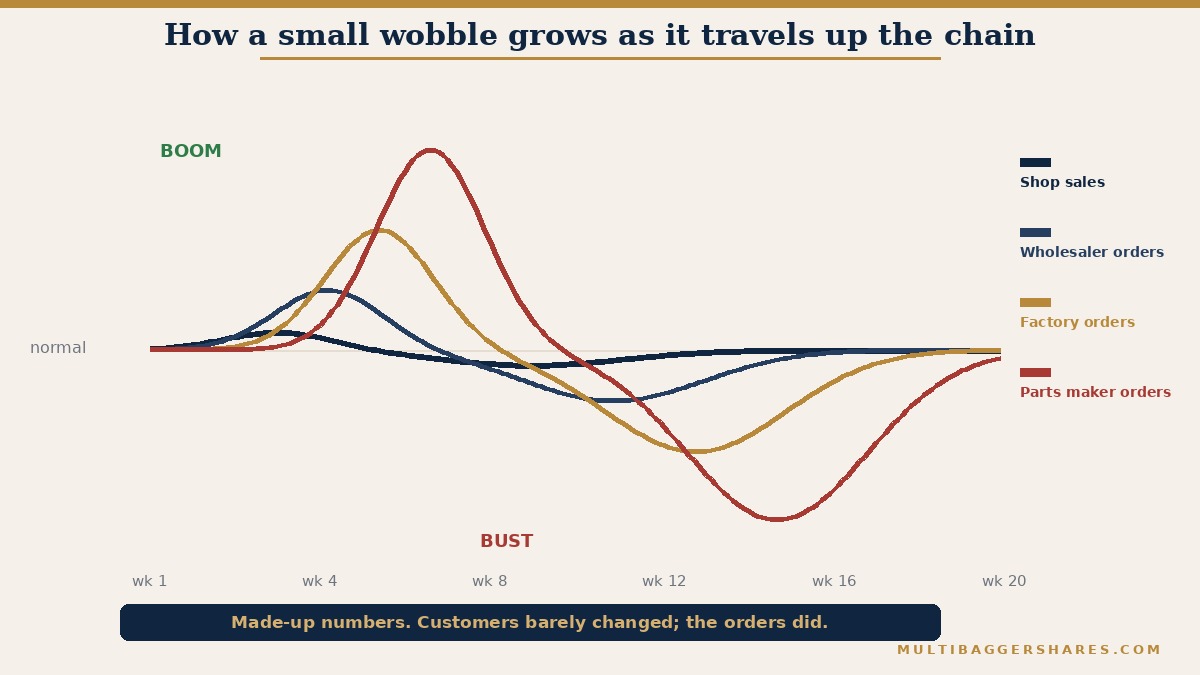
Then the weather turns normal. Customers in Lucknow go back to buying about 100 fans a week, just as before. But now every shop has fans stacked to the ceiling. The shops stop ordering. The wholesaler stops ordering. The factory, with a full warehouse, stops buying motors. For many weeks the parts maker gets almost no orders at all. A business at the far end of the chain lived through a boom and a bust, even though the people of Lucknow bought fans at an almost steady pace the whole time. All the numbers in this story are made up, but the pattern is real, and it has a name.
What it really means
The name is the bullwhip effect (the way small changes in what customers buy grow into bigger and bigger swings in orders as you move away from the customer, towards the factory and its suppliers). Think of a cowboy’s whip. A small flick of the wrist at the handle becomes a wide, fast wave at the tip. In a business chain, the customer holds the handle. The supplier furthest away stands at the tip.
To follow the idea, you only need one more word: the supply chain (the line of businesses that pass a product along, from the people who make the raw materials, to the factory, to the wholesaler, to the shop, to you). Every link in that line is a separate business. Each one sees only the orders that come from the link just in front of it. Very few of them can see the real customer.
The idea is older than most people think. In 1958, an engineer turned management professor at MIT named Jay Forrester wrote about it in the Harvard Business Review. Studying how home appliances moved from factories to shops, his work showed that a 10 percent rise in shop sales could make factory orders jump by about half, as MIT Sloan Management Review later retold the story. A few months later the shops were full, orders were cut, and factory output ended up below where it had started.
In the early 1960s, Forrester’s group at MIT turned this into a classroom game. It later became famous as the Beer Game (a board game in which four players run a shop, a wholesaler, a distributor and a brewery, and can only see the orders that reach them). The name was later made famous by three professors, Hau Lee, V. Padmanabhan and Seungjin Whang, who published two papers on it in 1997.
Why it works
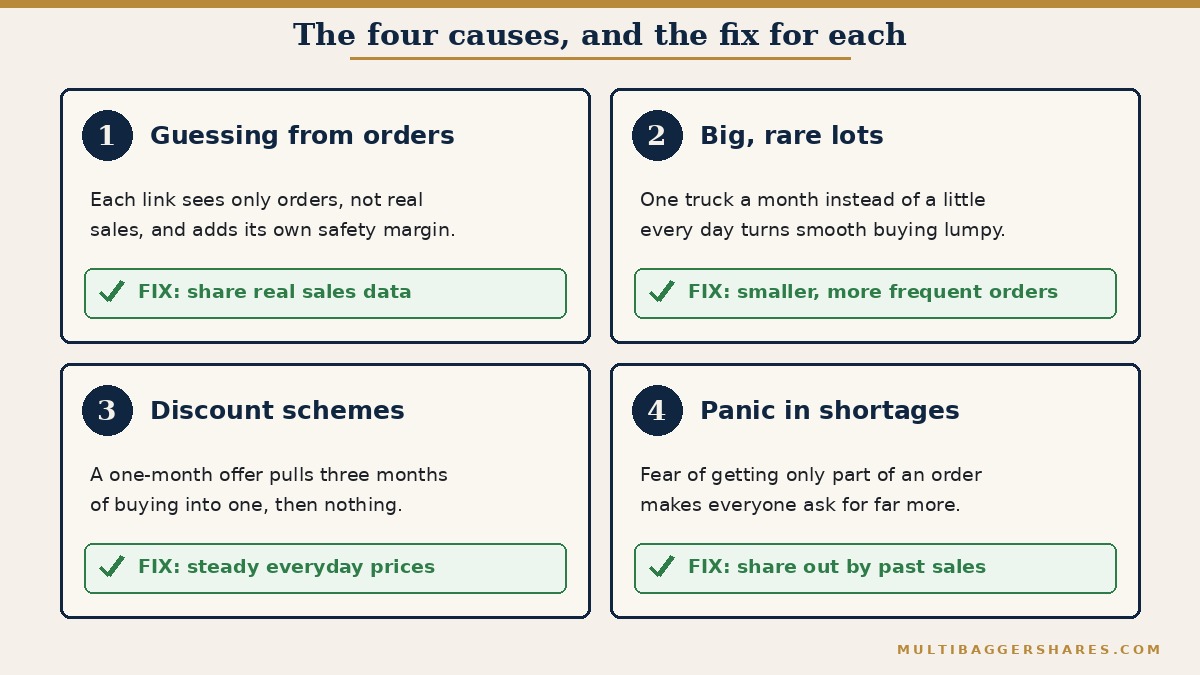
Why does a small wobble grow? Not because people are foolish. Each person in the chain is doing something that looks sensible from where they stand. The 1997 study found four main causes, and each one is easy to picture.
The first cause is guessing from orders instead of real sales. Mr Gupta knows how many fans he sold. The wholesaler does not. The wholesaler sees only orders, and an order of 200 looks like a sign that demand has doubled. He adds his own safety margin on top. The factory then sees his order and adds its own. It is like the children’s game of passing a whispered message around a circle. By the end, the message has changed far more than anyone meant.
The second cause is ordering in big, rare lots. Many shops find it cheaper to place one large order a month, so a full truck comes at once, than a small order every day. Customers buy a little every day, but the factory sees a huge order one week and nothing the next. Like a monsoon, it pours one day and is dry the next.
The third cause is discount schemes (special price offers for a short time). When a factory offers 10 percent off for one month, sensible dealers buy three months of stock that month. Then they buy almost nothing for the next two months. The factory created its own boom and bust. Customers did not change at all.
The fourth cause is panic ordering in a shortage. If shops fear that the factory will give each of them only part of what they ask for, they ask for far more than they need, hoping to get enough. When the shortage ends, those inflated orders vanish overnight. Anyone who remembers the rush for toilet paper and hand sanitiser in the early months of the pandemic has seen this up close.
Notice what all four causes have in common. The real need of the customer barely moved. What moved was the information. Each link in the chain added a little worry, a little delay and a little guessing on top of what it received. Hau Lee put it simply years later, in a conversation with Stanford: everyone adds something to the signal, and it results in a big surge, up and down.
A real example or two
Here are a few stories from business history. They are told only to teach the idea, not as a view on any company or its shares.
The first story comes from Procter & Gamble, the American maker of Pampers diapers. When Lee and his colleagues visited the company, a senior supply manager told them that orders for diapers swung up and down and were hard to predict. That puzzled the professors. Babies use diapers at a fairly steady rate. Yet as the orders travelled from parents to shops, from shops to distributors, and from distributors to the factory, the swings grew larger at every step. The steadiest product you could imagine was creating jumpy orders. Their 1997 paper on this pattern was later voted one of the ten most influential papers ever published in the journal Management Science.
Procter & Gamble later worked on the problem by getting closer to the real customer. Instead of waiting for big orders, it began to see sales data from large retail customers such as Walmart and to help manage the stock on their shelves directly. This is called vendor-managed inventory (when the supplier, not the shop, watches the shop’s stock and decides when to send more). The lesson is not that every business can do this. The lesson is that seeing the real sales calmed the whip.
The second story is the Beer Game itself, played by thousands of students and managers over the years. John Sterman of MIT studied the results and published them in 1989. In the game, customer demand changes only once: it goes from four cases of beer a week to eight, and then stays there. That is all. Yet in a typical game, the brewery’s orders at their peak are more than double the shop’s peak. Teams run up costs about ten times higher than they needed to. And when asked what went wrong, most players blame the customers, even though customer demand was perfectly steady after that one change.
Sterman’s finding matters for investors. Smart, well-meaning people, each doing their best with what they can see, still create wild swings when they cannot see the whole chain. So when an investor looks at a business, a useful question is not only how good the business is, but also how much of the whip it has to hold.
How you can use it
Now go back to Lucknow and imagine two fan factories. Ravi’s factory sees only the orders that dealers send. He sells in big monthly lots and runs a discount scheme every few months to meet his targets. His sales chart looks like a mountain range. In good months he hires extra workers and borrows to buy materials. In bad months he lays people off and struggles to pay the bank.
Sunita’s factory does three simple things. She asks her main dealers to share how many fans they actually sold each week, through a simple message on the phone. She sends smaller lots more often. And she keeps her prices steady through the year, with no sudden schemes. Her sales still rise in summer and fall in winter, because that is the real pattern of the weather. But they do not jump about for no reason. Her workers stay, her machines run evenly, and she needs far less borrowed money. Over ten years, the steady business is likely to be the stronger and calmer one to own.
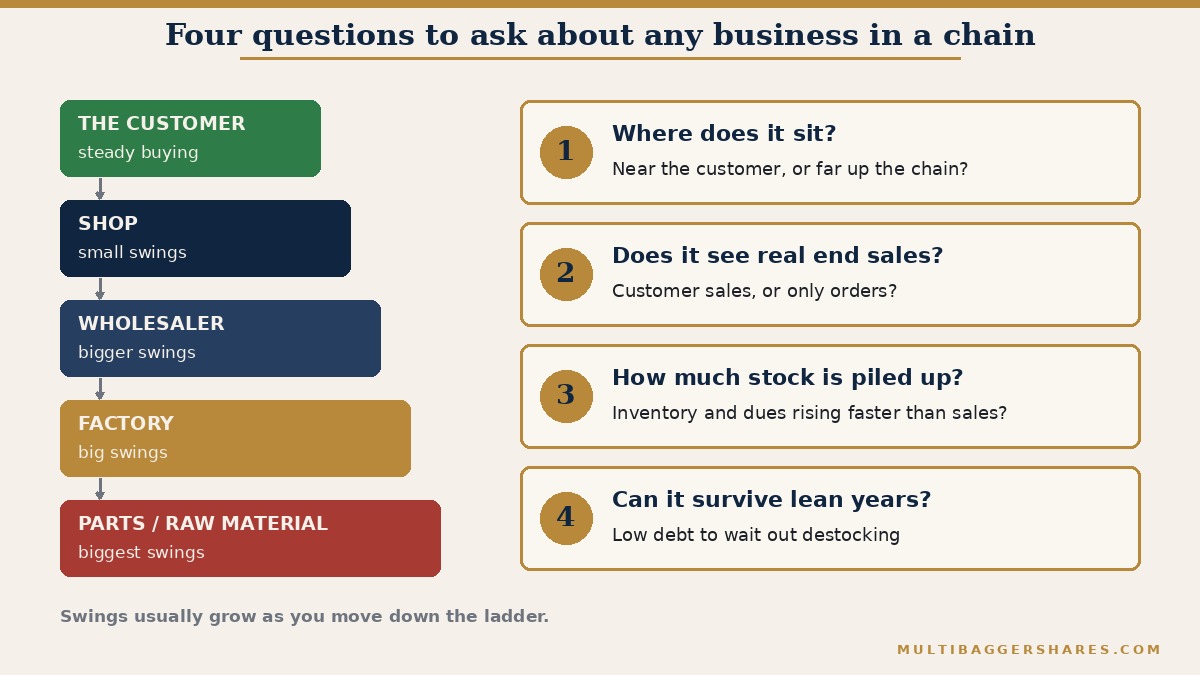
You will not be able to see inside a factory, but you can look for clues. Here are four questions that work for almost any business that sits in a chain.
One: where does it sit? A business that sells straight to the final customer, like a shop or a consumer brand, usually feels small swings. A business that makes parts, chemicals or raw materials for other factories, far from the customer, usually feels the whip much harder. Neither is good or bad on its own, but you should expect a bumpier ride from the second kind and judge it over a full cycle, not one good year.
Two: does it see real end sales? Read what managers say in the annual report and in their calls with investors. Do they talk about what customers are actually buying, or only about the orders they received? Phrases like channel inventory (the stock sitting with dealers and distributors, not yet sold to customers) and destocking (when dealers stop ordering in order to sell down the pile they already hold) are signs that the whip is moving. A management team that tracks real customer sales, and explains the difference clearly, is showing you something about its quality.
Three: how much stock is piled up? Look at inventory (goods made or bought but not yet sold) and at receivables (money that dealers still owe the company) over several years. If sales jump while both of these jump even faster, the company may simply be pushing goods into the chain. That boom often comes back as a bust a few quarters later.
Four: can it survive the bad years? A business at the far end of the whip will have lean years, even when nothing is wrong with it. That is why low debt (borrowed money that must be repaid with interest) matters even more for it. A business with little debt can wait out a destocking season. A business with heavy loans may be forced to sell assets or raise money at the worst time.
One more gentle warning. When orders boom, be careful about assuming that the boom is the new normal. Ask whether customers are really buying more, or whether the chain is simply filling up, as it did in Lucknow. And when orders crash, ask the same question the other way around. Sometimes the end customer has not gone anywhere, and the bust is just the chain emptying its shelves.
This is a lesson about judging the quality and the steadiness of a business, not a way to time the market. It does not tell you whether any share is worth buying today. It simply helps you understand why some good businesses have bumpy years, and why some managers, by staying close to the real customer, can make the ride far calmer.
Key takeaways
- The bullwhip effect is the way small changes in what customers buy grow into much bigger swings in orders further up the chain.
- It comes from four sensible-looking habits: guessing from orders, ordering in big lots, short-term discounts and panic ordering in shortages.
- Businesses far from the final customer, such as parts and raw-material makers, usually feel the whip hardest; judge them over a full cycle.
- Good managers calm the whip by seeing real end sales, sending smaller lots more often and keeping prices steady; look for these clues.
- This is a way to judge the quality and steadiness of a business. It is education only, not a judgement on any company or share.
— Manish Goel · multibaggershares.com
Manish Goel is a Chartered Accountant and Principal Officer of Multibagger Securities Research & Advisory Pvt. Ltd. (MSRAPL), a SEBI-registered Investment Adviser, Registration No. INA100007736. This content is published by MSRAPL for education only and is not personalized investment advice.
Disclaimer: This article is published by multibaggershares.com for education and general information only. It is not investment advice, investment research, or a recommendation to buy, sell or hold any security. Any companies named are discussed only as illustrative examples. Markets carry risk; please do your own research or consult a qualified professional before making any investment decision. |