Indian stock market

April 5, 2026
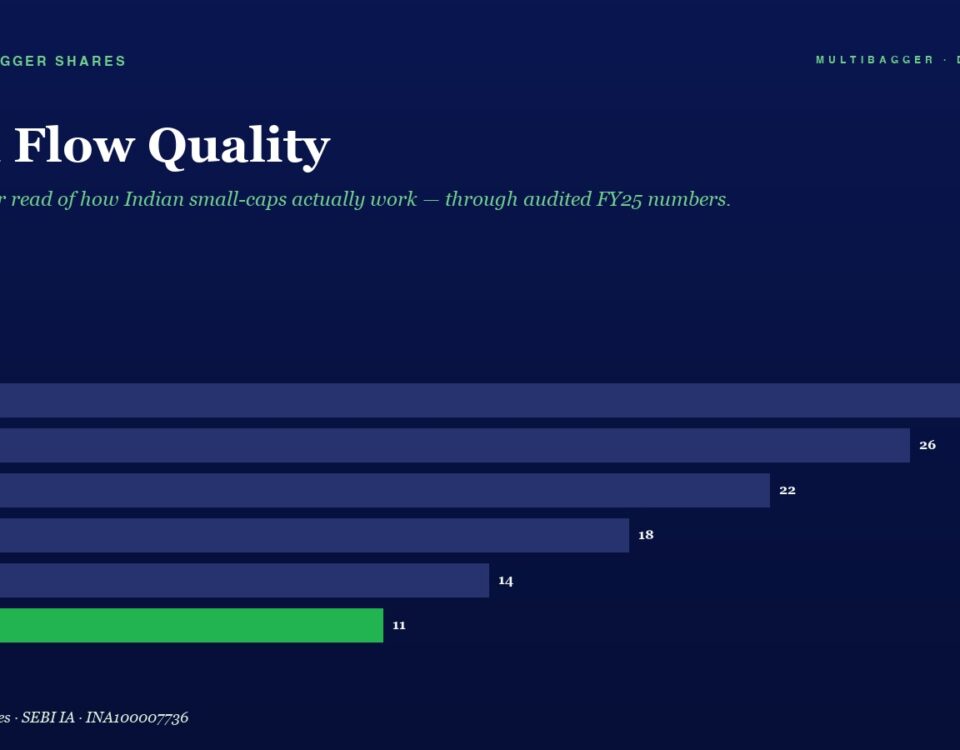
Infographic bar chart titled 'Cash Flow Quality' showing yearly values FY20–FY25, green bar for FY25 with value 11, others: 28, 26, 22, 18, 14.

Cash Flow Quality

Published April 5, 2026 (Saturday) The Single Most Important Number in Fundamental Analysis Every experienced value investor knows a dirty secret about the stock market: profits […]
April 4, 2026
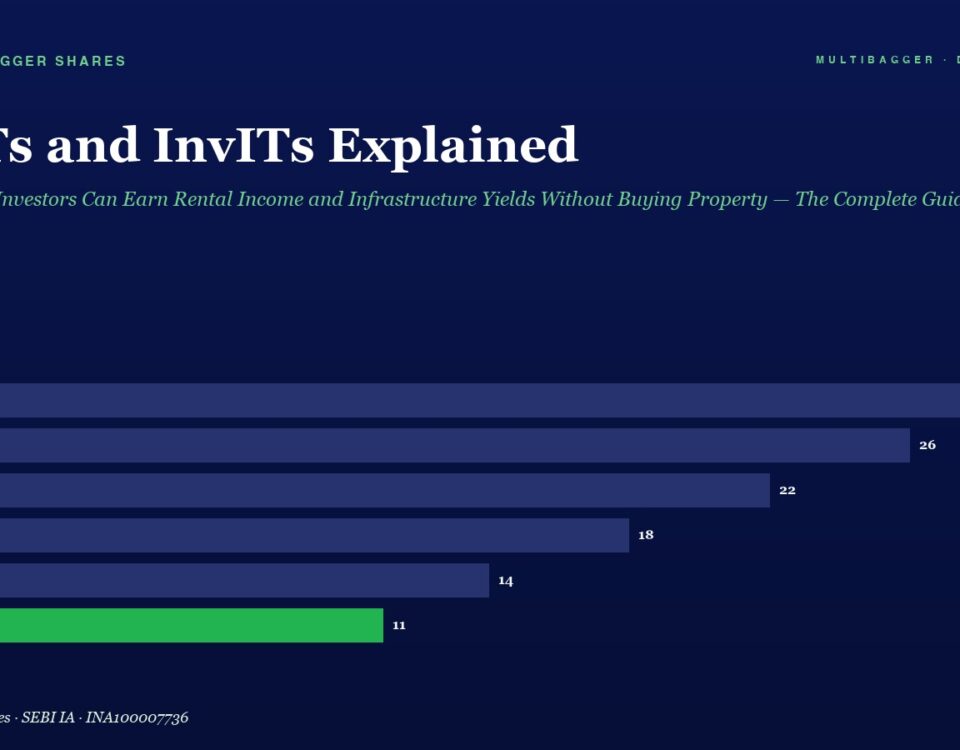
Infographic titled 'REITs and InvTs Explained'; horizontal bar chart shows FY20 28, FY21 26, FY22 22, FY23 18, FY24 14, FY25 11 (FY25 bar in green).

REITs and InvITs Explained: How Indian Investors Can Earn Rental Income and Infrastructure Yields Without Buying Property — The Complete Guide to India’s Most Underused Wealth-Building Instruments

📅 Published April 04, 2026 (Saturday) The Problem: You Want Real Estate Income, But You Can’t Afford a ₹2 Crore Apartment Here’s a painful truth that […]
April 4, 2026
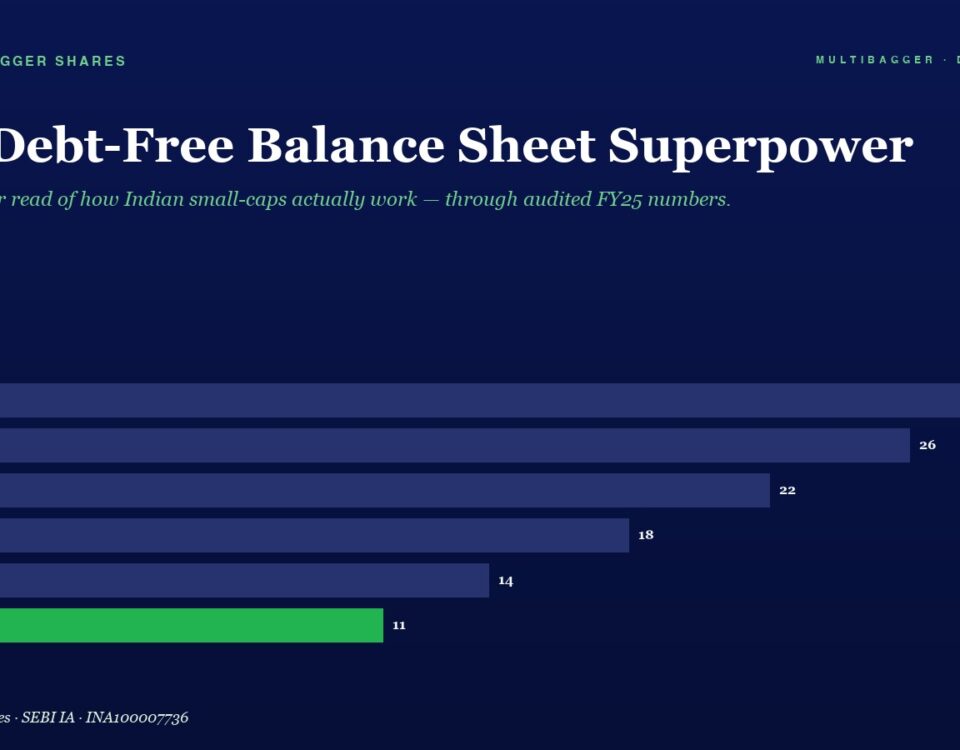
Hero image with the title 'The Debt-Free Balance Sheet Superpower' and a dark-blue bar chart of FY20–FY25 values (28 to 11).

The Debt-Free Balance Sheet Superpower

📅 Published April 4, 2026 (Saturday) 🏰 Today’s Fundamental Analysis Lesson: The Debt-Free Balance Sheet Superpower SEBI’s landmark study revealed that 9 out of 10 individual […]
April 4, 2026
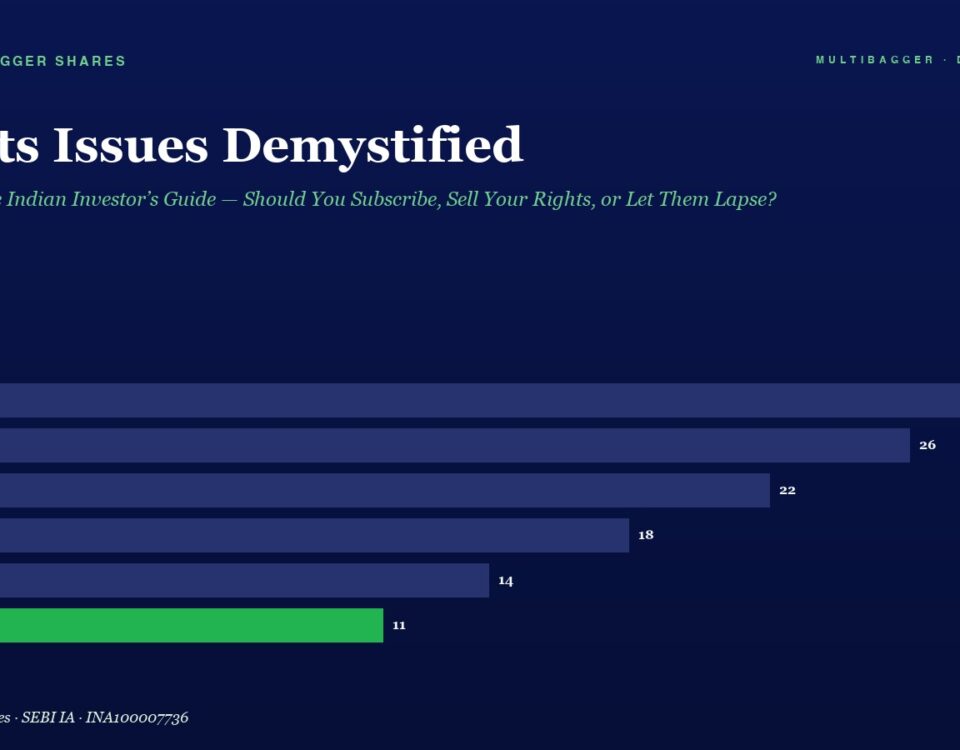
Title 'Rights Issues Demystified' with a dark blue infographic showing yearly bars FY20–FY25; FY25 bar is green and value 11.

Rights Issues Demystified: The Complete Indian Investor’s Guide — Should You Subscribe, Sell Your Rights, or Let Them Lapse?

FY 2025-26 has seen 120+ rights issues raising ₹39,439 crore — a 95% jump. Every Indian investor WILL face a rights issue. Should you subscribe, sell your RE shares, or let them lapse? This complete guide explains how to evaluate any rights issue using a 5-point framework, with real Indian market examples.
+91-8448836436