April 9, 2026
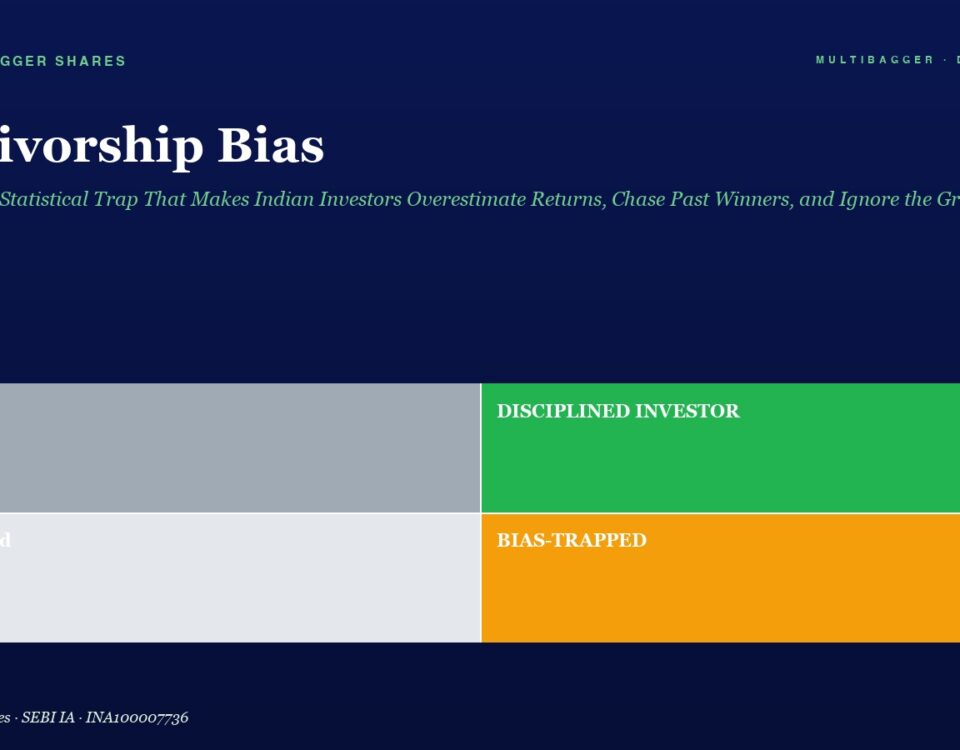
Hero header with dark blue background reading 'Survivorship Bias' and subtitle; below is a four-block infographic: left column has 'Lucky' (top, gray) and 'Confused' (bottom, light gray); right column has 'DIScIPLINED INVESTOR' (top, green) and 'BIAS-TRAPPED' (bottom, orange).

Survivorship Bias: The Invisible Statistical Trap That Makes Indian Investors Overestimate Returns, Chase Past Winners, and Ignore the Graveyard of Failed Stocks — How to Think Clearly About Market Data and Build a Truly Resilient Portfolio

📅 Published April 09, 2026 (Thursday) The Dangerous Illusion: Why the Stocks You Study Are Not the Full Picture Every Indian investor has heard stories like […]
April 9, 2026
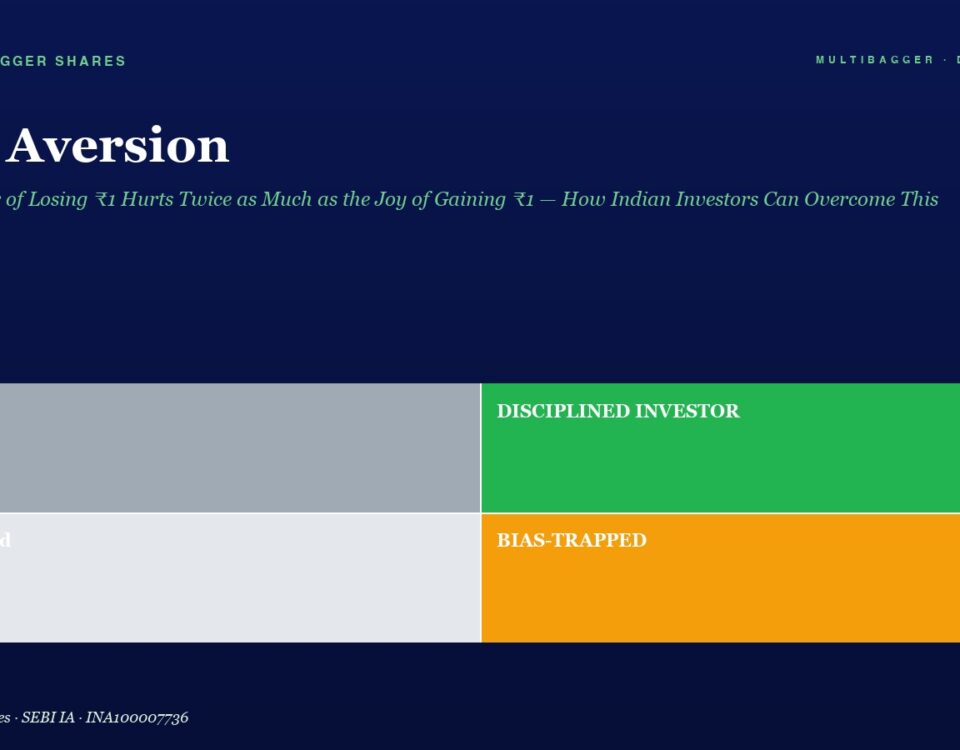
Header with the title 'Loss Aversion' and subtitle about Indian investors; below is a four‑block infographic: top-left 'Lucky' (grey), top-right 'Disciplined Investor' (green), bottom-left 'Confused' (light grey), bottom-right 'Bias-Trapped' (orange) indicating investor emotions.

Loss Aversion: Why the Fear of Losing ₹1 Hurts Twice as Much as the Joy of Gaining ₹1 — How Indian Investors Can Overcome This Devastating Bias and Hold Multibaggers for the Long Term

📅 Published April 09, 2026 (Thursday) The ₹1 Lakh Experiment That Reveals Your Biggest Investment Weakness Imagine two scenarios. In the first, you check your portfolio […]
April 9, 2026
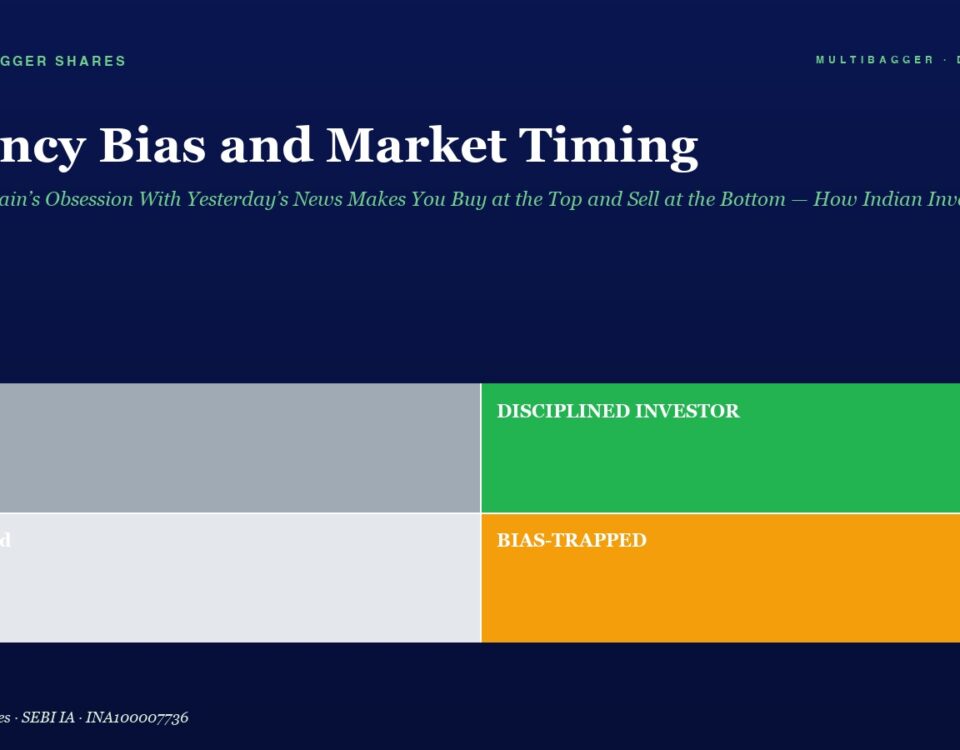
Hero header with title 'Recency Bias and Market Timing' and subtitle; a two-by-two color grid shows four blocks labeled Lucky (top-left gray), DISCIPLINED INVESTOR (top-right green), Confused (bottom-left light gray), and BIAS-TRAPPED (bottom-right orange).

Recency Bias and Market Timing: Why Your Brain’s Obsession With Yesterday’s News Makes You Buy at the Top and Sell at the Bottom — How Indian Investors Can Overcome This Devastating Mental Trap and Build Long-Term Wealth

📅 Published April 9, 2026 (Wednesday) The Market Just Gave You a Perfect Lesson in Recency Bias Yesterday, on April 8, 2026, Indian markets exploded higher […]
April 9, 2026
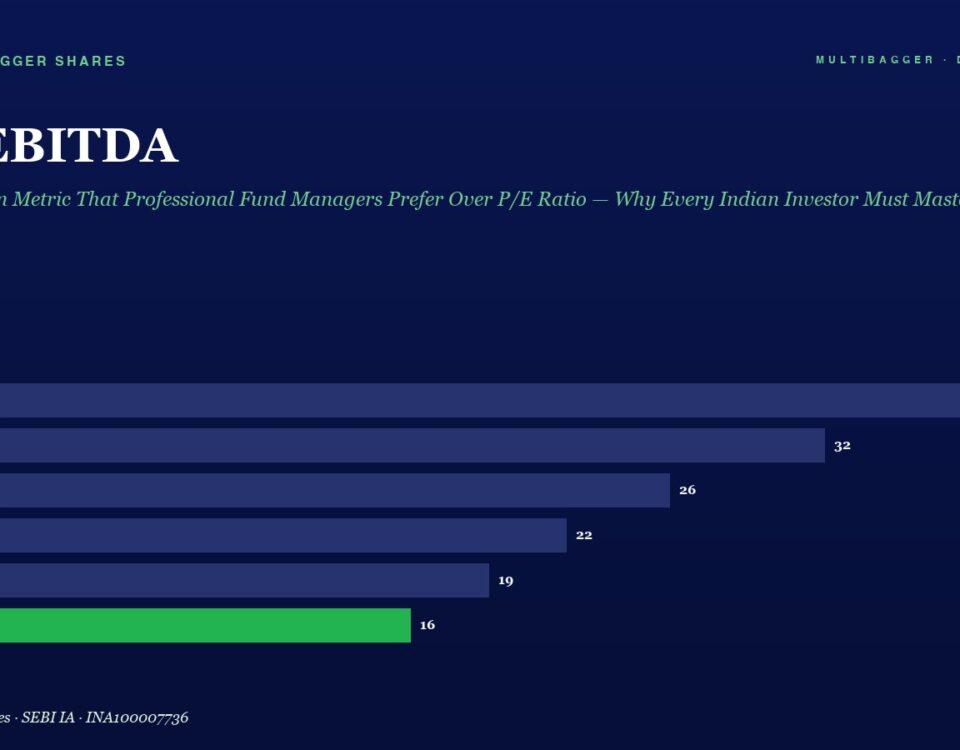
Header for an EV/EBITDA article with a green subtitle, then a horizontal bar chart of FY20–FY25 values: 38, 32, 26, 22, 19, 16 (FY25 bar in green).

EV/EBITDA: The Valuation Metric That Professional Fund Managers Prefer Over P/E Ratio — Why Every Indian Investor Must Master This Superior Tool to Find Undervalued Multibaggers

📅 Published April 9, 2026 (Wednesday) Why P/E Ratio Alone Can Mislead You — And What the Pros Use Instead If you ask any retail investor […]
+91-8448836436