
Track Record of Identifying Rare Wealth Creators
March 27, 2026
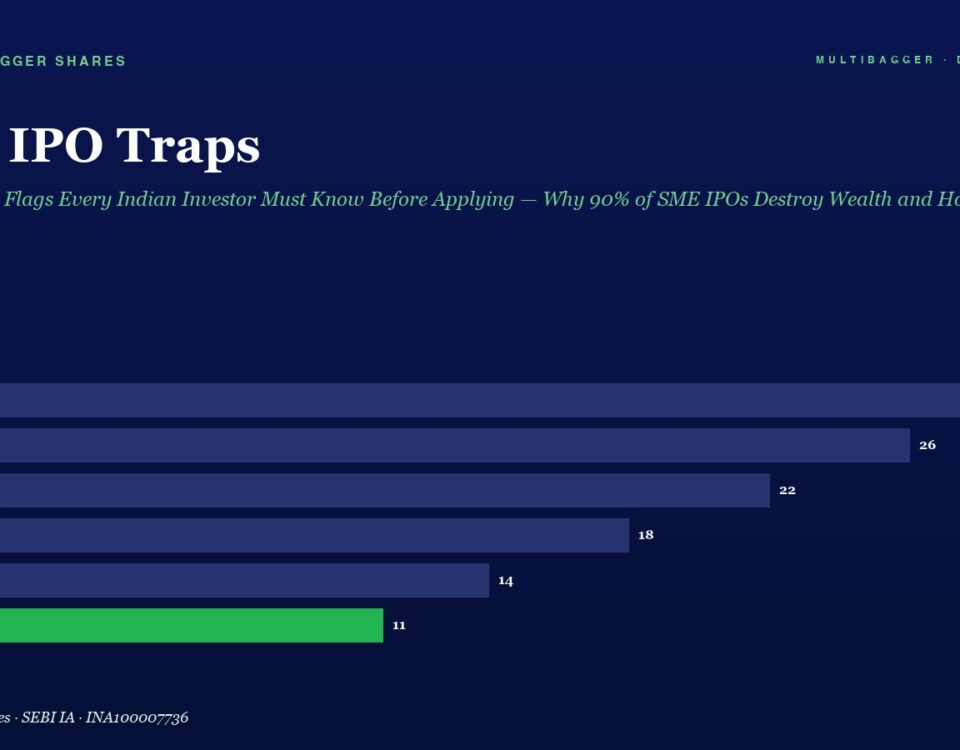
Infographic titled SME IPO Traps: horizontal bar chart of yearly figures FY20–FY25, with FY25 highlighted in green at 11 and previous bars in blue hues.

SME IPO Traps: 7 Deadly Red Flags Every Indian Investor Must Know Before Applying — Why 90% of SME IPOs Destroy Wealth and How to Protect Your Capital

📅 Published March 27, 2026 (Thursday) The SME IPO Frenzy That’s Burning Indian Retail Investors India is in the grip of an unprecedented SME IPO boom. […]
March 27, 2026
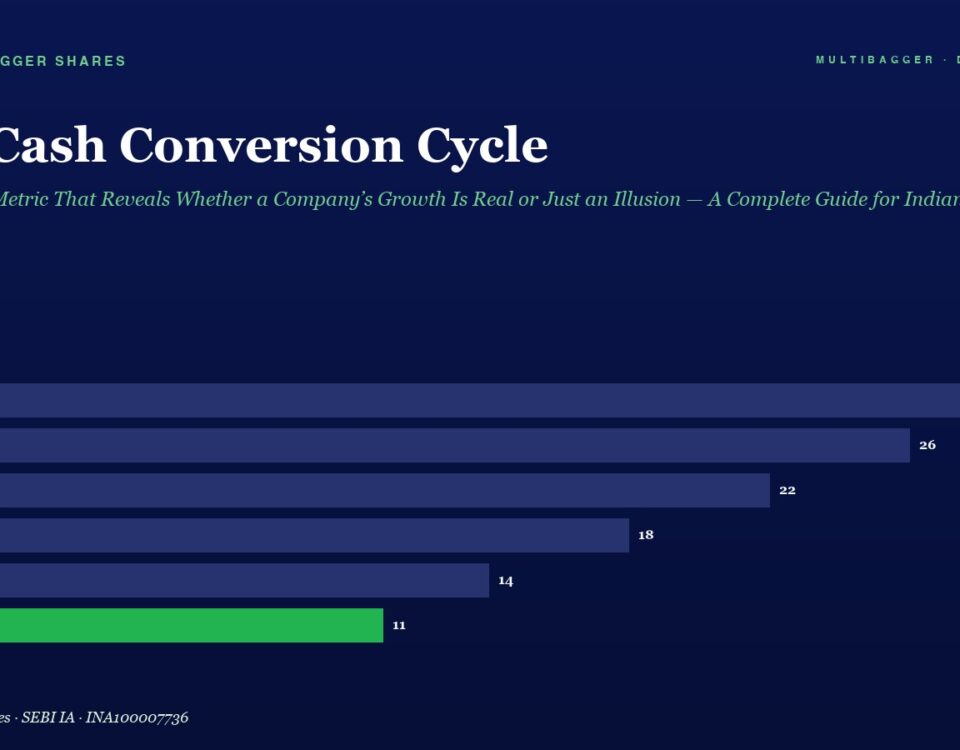
Infographic showing cash conversion cycle in days from FY20 to FY25; bars decline from 28 to 11 days, last bar green.

The Cash Conversion Cycle: The Hidden Metric That Reveals Whether a Company’s Growth Is Real or Just an Illusion — A Complete Guide for Indian Investors

📅 Published March 27, 2026 (Friday) Introduction: Why Profit Alone Can Deceive You On a day like today — March 27, 2026 — with the Sensex […]
March 26, 2026
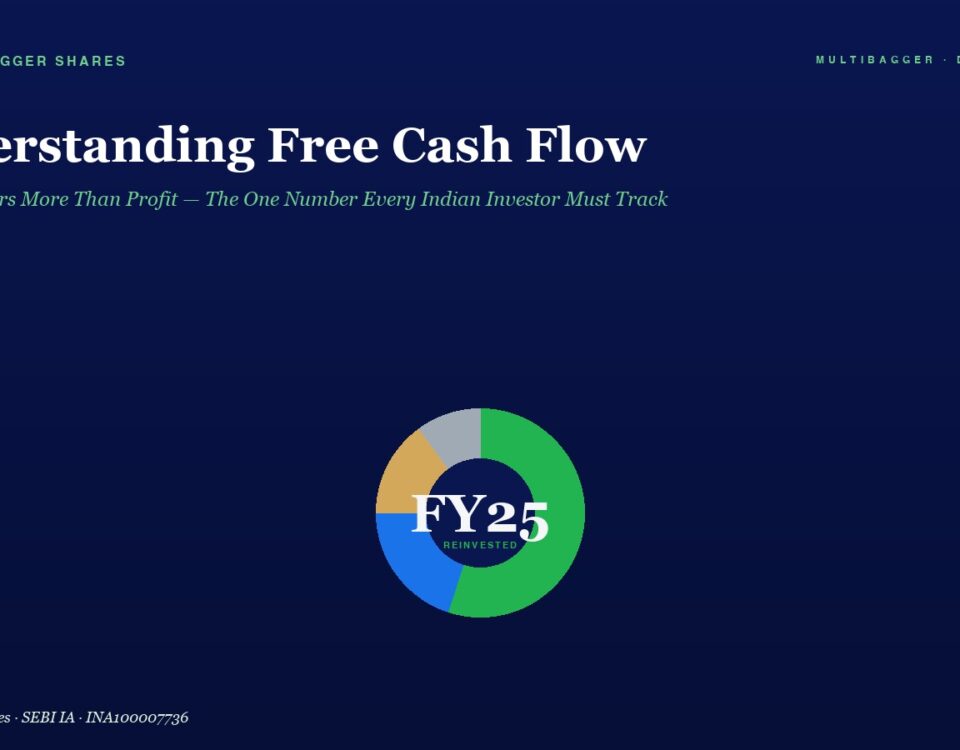
Hero header with article title 'Understanding Free Cash Flow' and subtitle on a dark blue background, featuring a centered donut chart labeled FY25 Reinvested.

Understanding Free Cash Flow: Why It Matters More Than Profit — The One Number Every Indian Investor Must Track

Free Cash Flow is the most important number that 90% of Indian investors ignore. Learn why FCF matters more than net profit, how to evaluate stocks using FCF, and why quality compounders with strong cash generation create generational wealth.
March 25, 2026
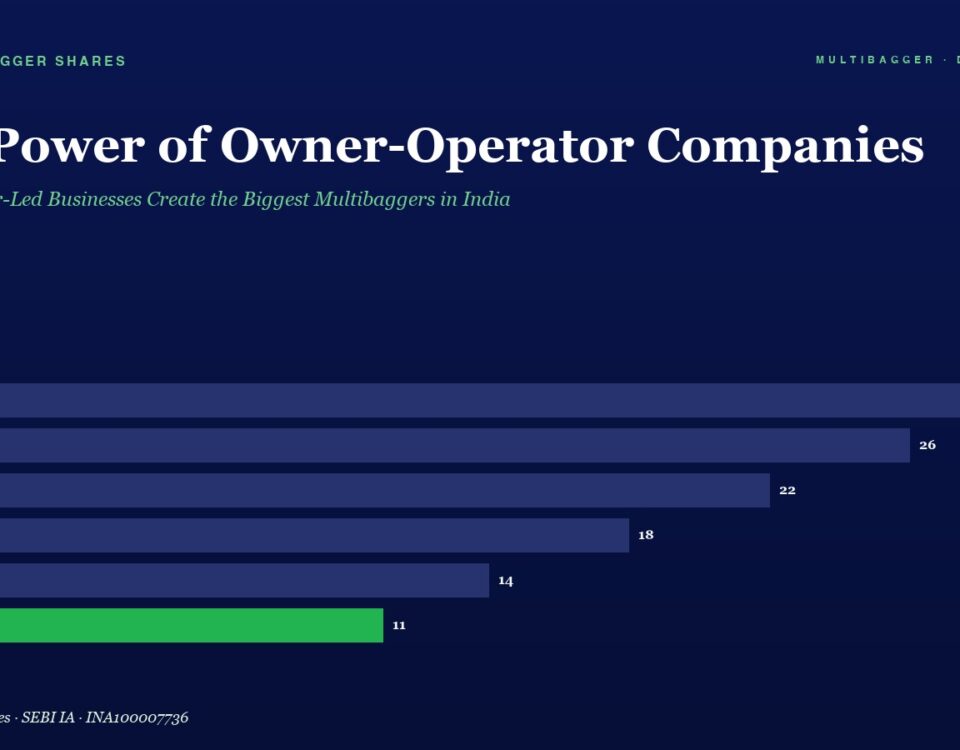
Horizontal bar chart of yearly figures from FY20 to FY25, with values FY20 28, FY21 26, FY22 22, FY23 18, FY24 14, FY25 11; FY25 bar is green.

The Power of Owner-Operator Companies: Why Founder-Led Businesses Create the Biggest Multibaggers in India

When the CEO's wealth is tied to YOUR wealth, magic happens. Learn how to identify owner-operator companies in India — the most powerful filter for finding multibagger stocks.
+91-8448836436