
Track Record of Identifying Rare Wealth Creators

Titan Biotech

May 7, 2026
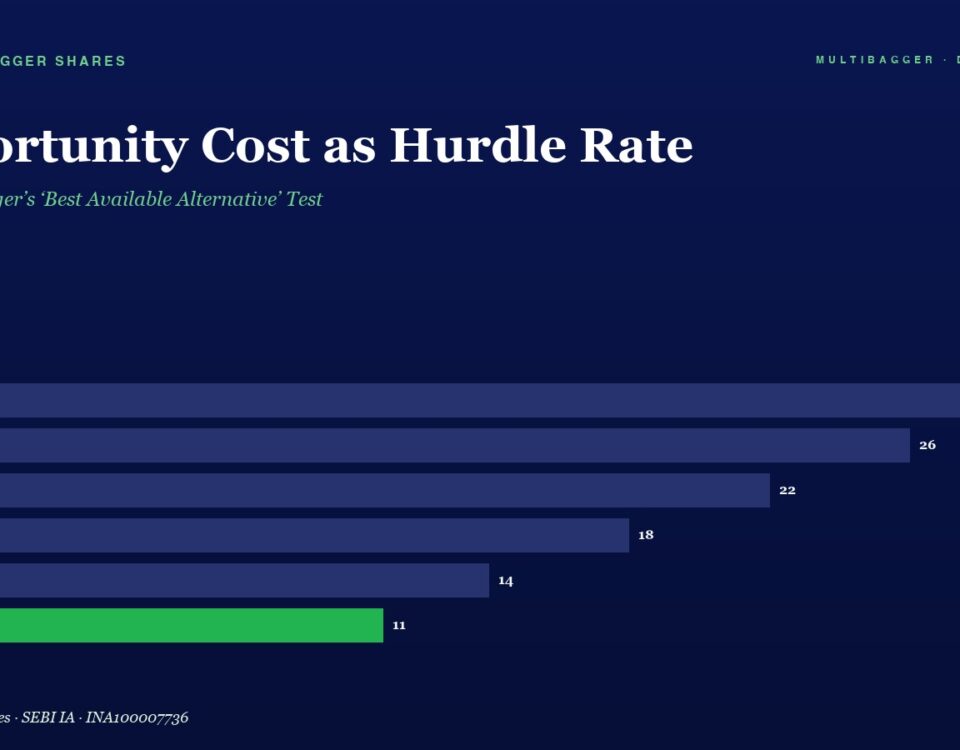
Chart: Opportunity Cost as Hurdle Rate by fiscal year FY20–FY25, with bars showing values 28, 26, 22, 18, 14 and a green FY25 bar at 11%.

Opportunity Cost as Hurdle Rate: Charlie Munger’s ‘Best Available Alternative’ Test

Charlie Munger's lifetime discipline: every rupee must beat the next-best alternative use, on a risk-adjusted basis. How Indian long-term investors apply the hurdle-rate test using the 10-year G-sec, and why Titan Biotech FY25's audited RoCE spread illustrates the discipline.
April 29, 2026
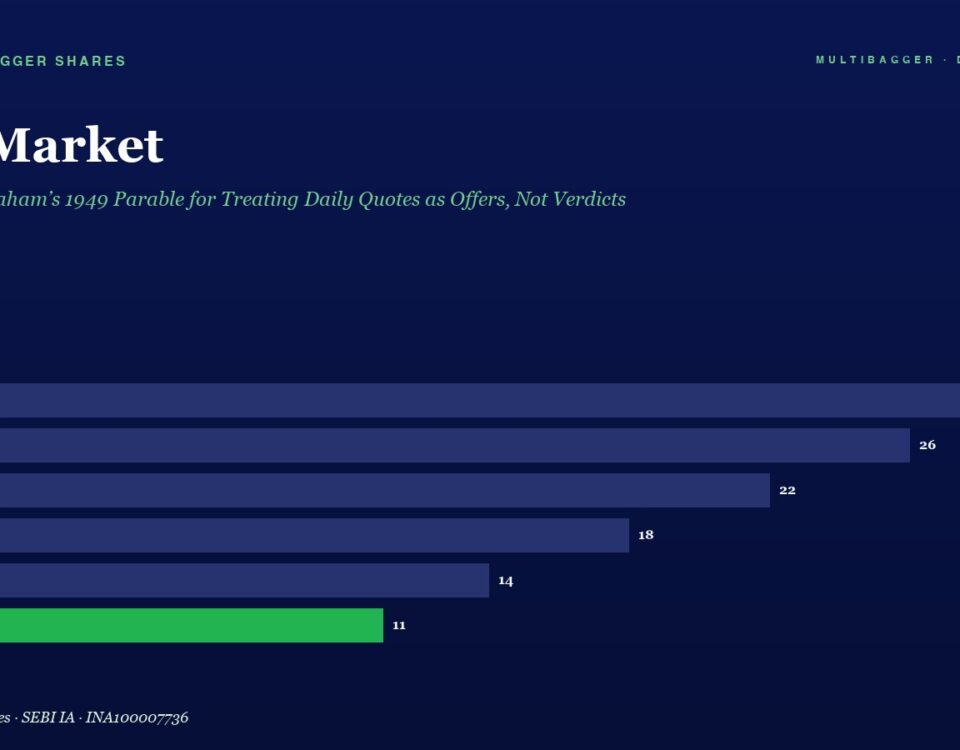
Dark blue page header with 'Mr. Market' title and subtitle, followed by a horizontal bar chart of yearly figures FY20–FY25 (FY25 in green, value 11).

Mr. Market: Benjamin Graham’s 1949 Parable for Treating Daily Quotes as Offers, Not Verdicts

Benjamin Graham's 1949 Mr. Market parable is the operating system for ignoring daily price quotes. Titan Biotech FY25's audited quiet — ₹3 cr borrowings, 103% CFO/PAT, 36.4% ROCE — illustrates the underlying factory that survives every tick.
April 19, 2026
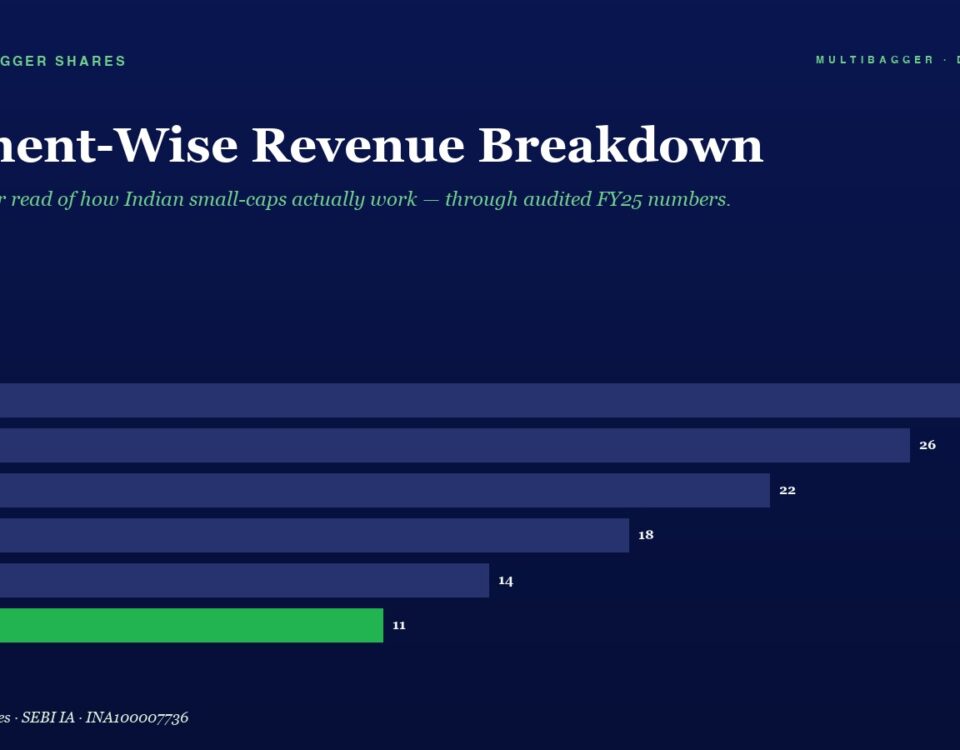
Infographic: segment-wise revenue breakdown bar chart from FY20 to FY25, dark blue background, green highlight for FY25; values shown at bar ends (28, 26, 22, 18, 14, 11). Title reads 'Segment-Wise Revenue Breakdown' with subtitle italic text beneath.

Segment-Wise Revenue Breakdown

Titan Biotech disclosed only one primary operating segment in FY25, a quiet but powerful sign that the business remains easier to understand and monitor than many small-cap peers.
April 19, 2026
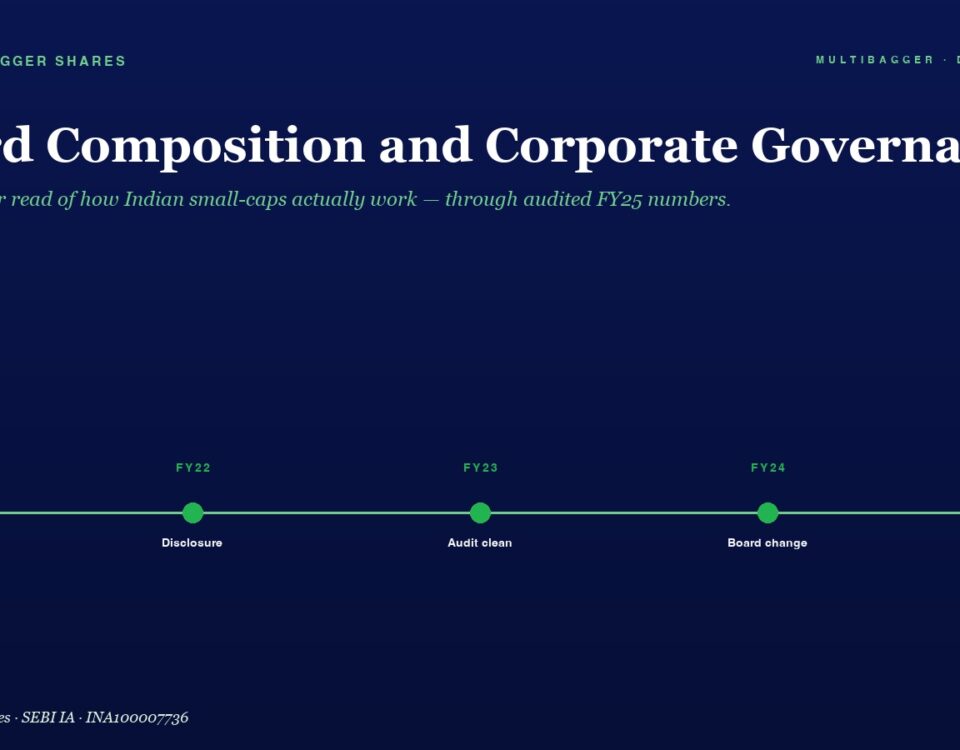
Hero section titled 'Board Composition and Corporate Governance' with a green subtitle, featuring a five-year timeline (FY21–FY25) of milestones: Compliance, Disclosure, Audit clean, Board change, All boxes.

Board Composition and Corporate Governance

Titan Biotech ended FY25 with an 11-member board, four independent directors, an independent chair, and 14 board meetings - a governance structure that merits serious attention from long-term investors.
+91-8448836436