
Track Record of Identifying Rare Wealth Creators

value investing

April 6, 2026
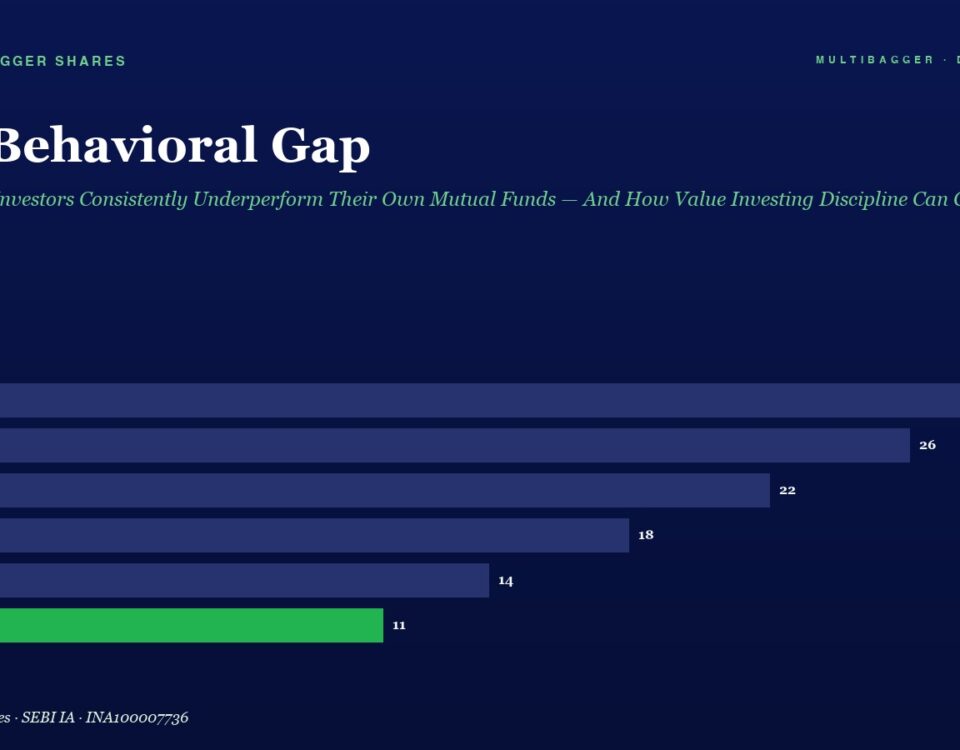
Title: The Behavioral Gap with a subtitle about Indian mutual funds; a horizontal bar chart shows FY20–FY25 values, culminating in FY25 at 11 with a green bar.

The Behavioral Gap: Why Indian Investors Consistently Underperform Their Own Mutual Funds — And How Value Investing Discipline Can Close the Gap Forever

📅 Published April 06, 2026 (Monday) The Shocking Truth: You Are Your Own Worst Enemy in the Stock Market Here is a question that should keep […]
April 6, 2026
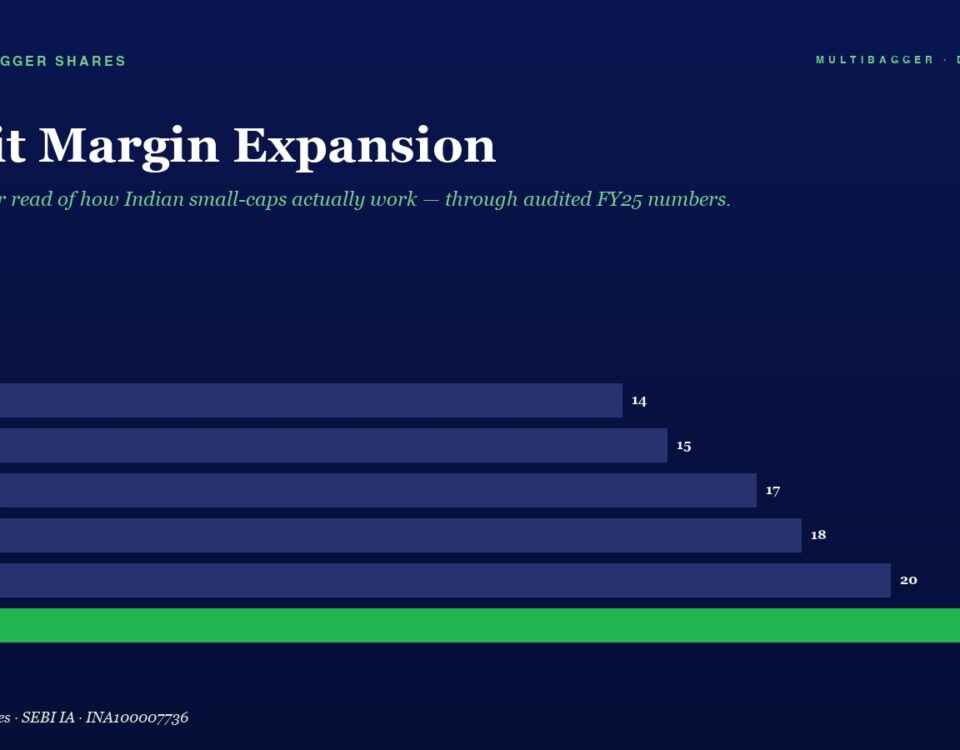
Profit Margin Expansion: horizontal bars show annual margins from FY20 (14%) to FY25 (22%), with FY25 highlighted in green.

Profit Margin Expansion

📅 Published April 6, 2026 (Monday) ⚠️ THE F&O GAMBLING EPIDEMIC According to SEBI’s own study, 9 out of 10 individual traders in the equity Futures […]
April 6, 2026
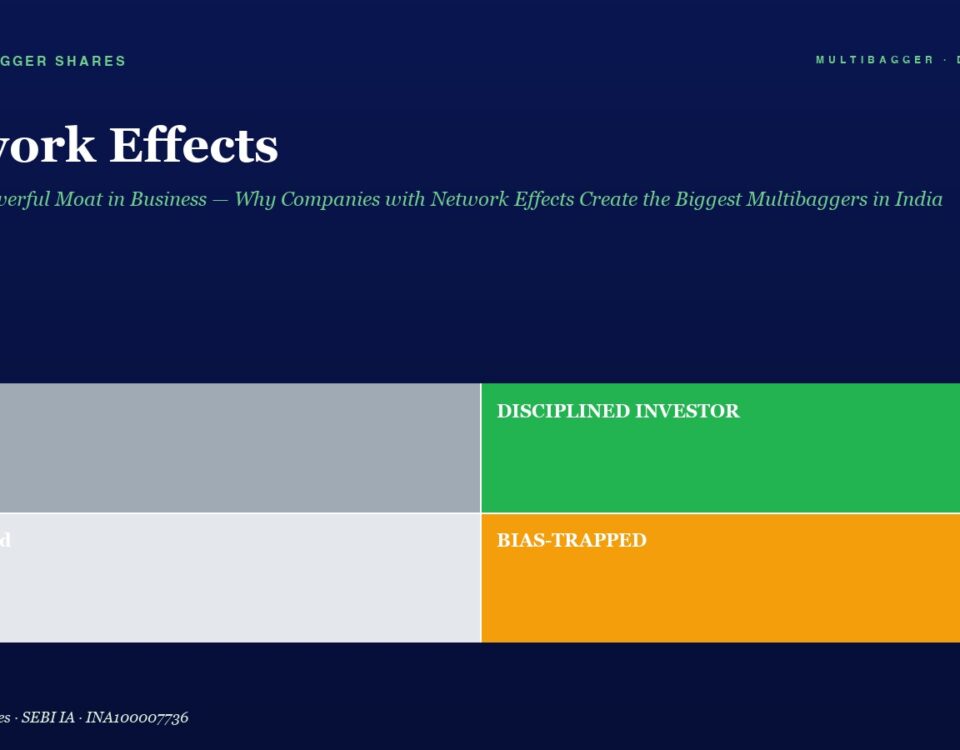
Infographic showing four investor archetypes in a two-by-two grid: Lucky (gray), Disciplined Investor (green), Confused (light gray), Bias-Trapped (orange) on a dark blue background with a title 'Network Effects' and subtitle.

Network Effects: The Most Powerful Moat in Business — Why Companies with Network Effects Create the Biggest Multibaggers in India

📅 Published April 06, 2026 (Monday) Introduction: Why Some Companies Become Unstoppable Imagine a telephone that only connects you to one person. Would you buy it? […]
April 6, 2026
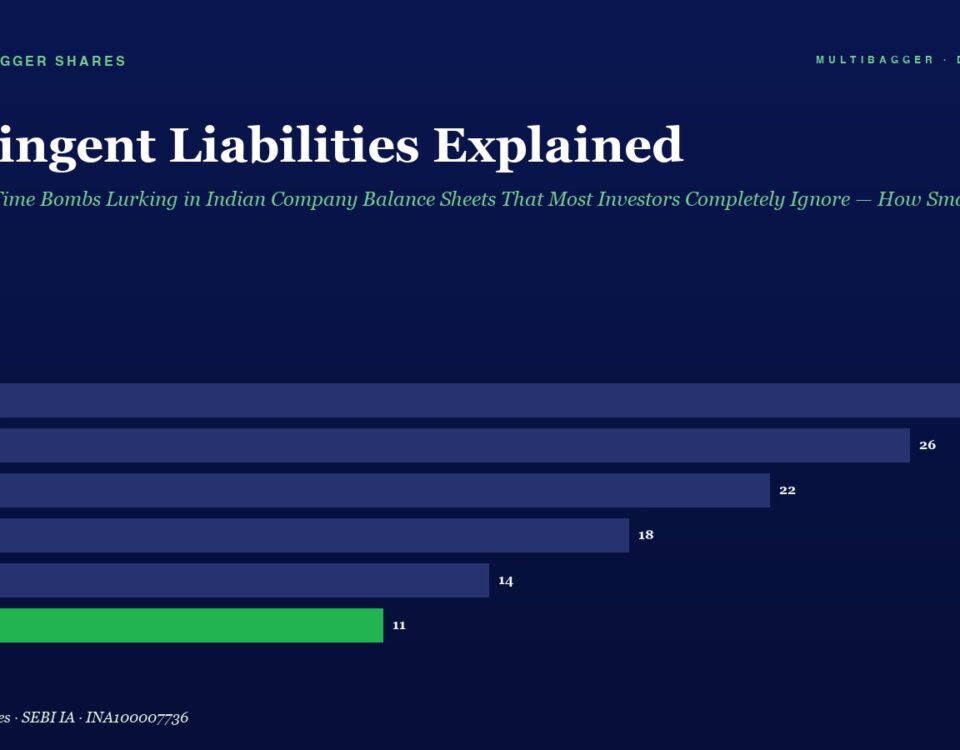
Horizontal bar chart titled 'Contingent Liabilities Explained' showing yearly values FY20–FY25; FY20 28, FY21 26, FY22 22, FY23 18, FY24 14, FY25 11 (green).

Contingent Liabilities Explained: The Hidden Time Bombs Lurking in Indian Company Balance Sheets That Most Investors Completely Ignore — How Smart Value Investors Use This Critical Note to Avoid Catastrophic Losses

📅 Published April 06, 2026 (Monday) Why the Smartest Investors Read the Footnotes First Here’s a question most Indian retail investors never ask: “What liabilities does […]
+91-8448836436