
Track Record of Identifying Rare Wealth Creators

value investing

April 8, 2026
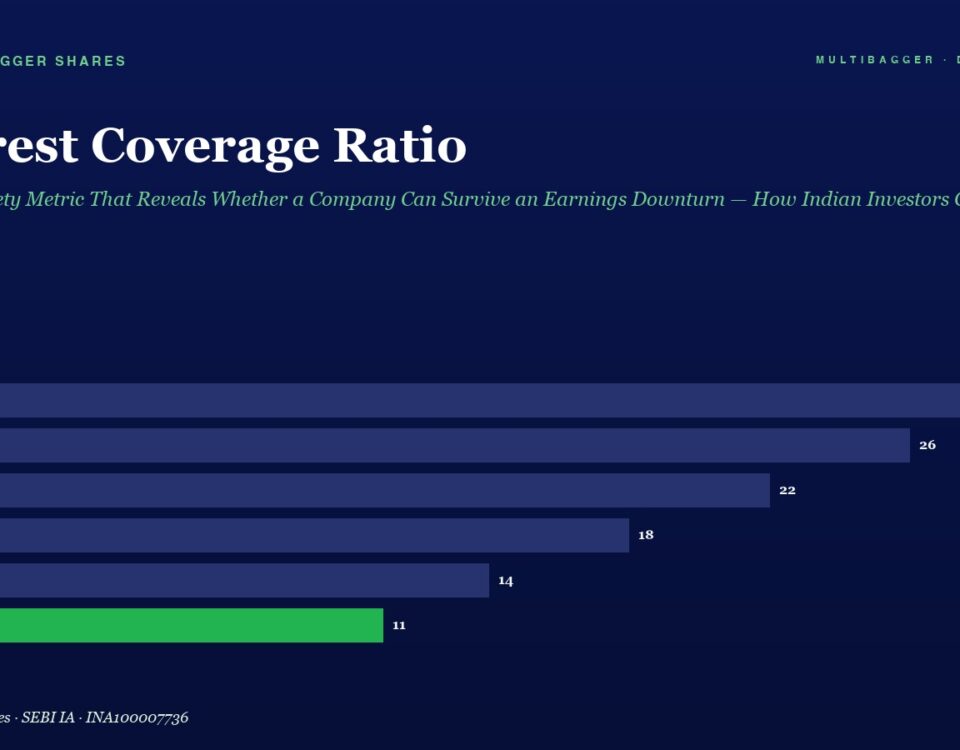
Blue horizontal bar chart of Interest Coverage Ratio by fiscal year FY20–FY25; FY25 is 11 (green bar), other values: FY20 28, FY21 26, FY22 22, FY23 18, FY24 14.

Interest Coverage Ratio: The Debt Safety Metric That Reveals Whether a Company Can Survive an Earnings Downturn — How Indian Investors Can Use ICR to Separate Fortress Businesses from Ticking Time Bombs

📅 Published April 08, 2026 (Wednesday) Why Most Indian Retail Investors Ignore the One Ratio That Could Save Them from Catastrophic Losses The Indian stock market […]
April 8, 2026
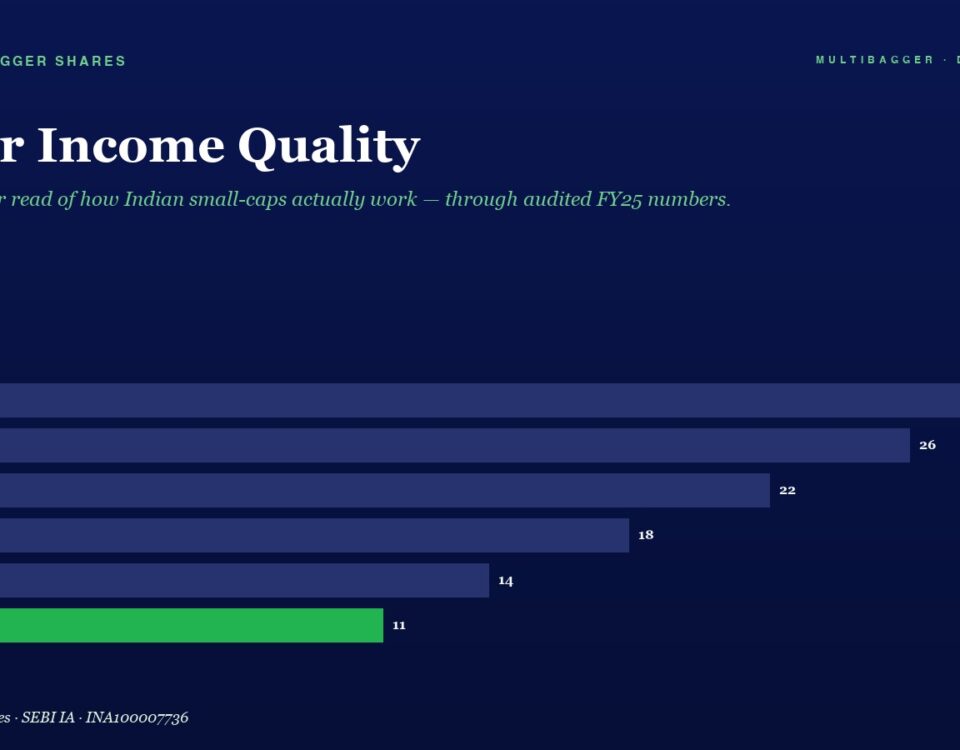
Infographic: 'Other Income Quality' with a horizontal bar chart of FY20–FY25; blue bars show values 28, 26, 22, 18, 14 and a green FY25 bar of 11, plus header/footer text.

Other Income Quality

When investors evaluate a company, they zoom straight to revenue and profit. But the Other Income line reveals the true quality of earnings. We analyse 12 years of Titan Biotech's Other Income data to prove its profits are genuinely driven by core operations — not one-time windfalls.
April 8, 2026
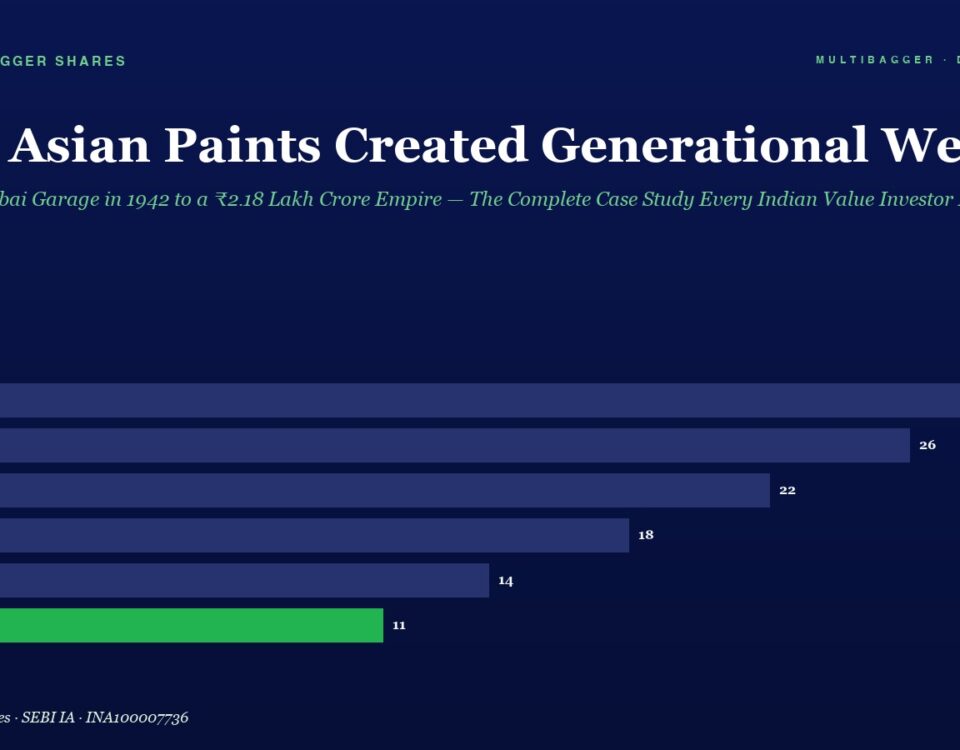
Hero header with title 'How Asian Paints Created Generational Wealth' and green subtitle; a horizontal bar chart shows FY20–FY25 values (28, 26, 22, 18, 14, 11) the last bar in green.

How Asian Paints Created Generational Wealth: From a Mumbai Garage in 1942 to a ₹2.18 Lakh Crore Empire — The Complete Case Study Every Indian Value Investor Must Study

📅 Published April 08, 2026 (Wednesday) The Greatest Wealth Creation Story in Indian Stock Market History If your grandfather had invested just ₹10,000 in Asian Paints […]
April 8, 2026
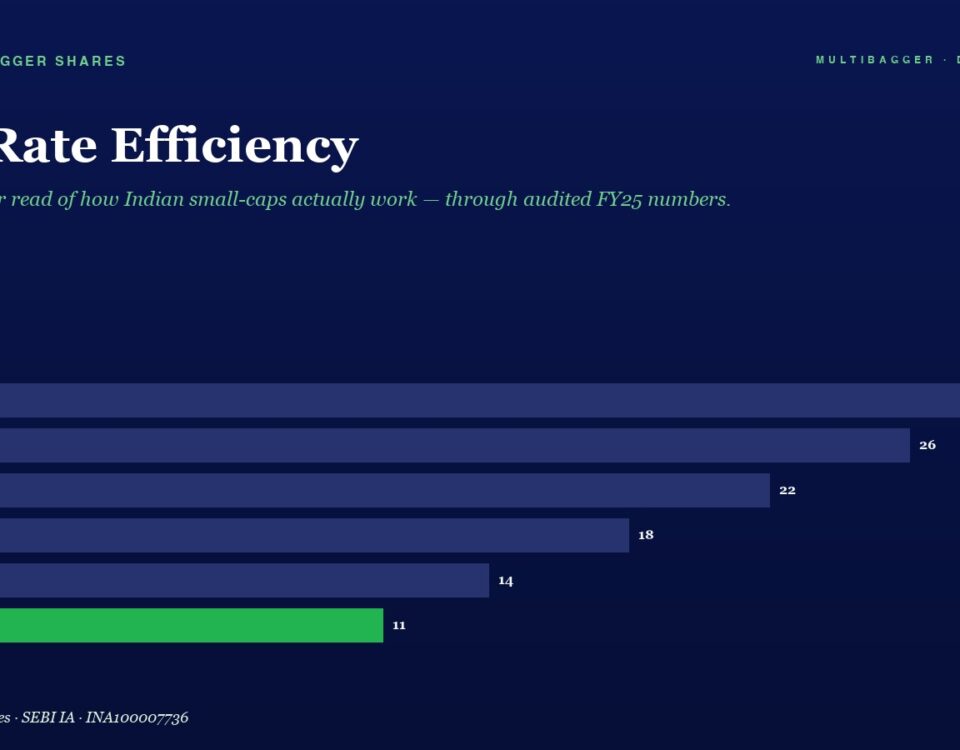
Infographic titled Tax Rate Efficiency; horizontal bars show yearly values FY20 28, FY21 26, FY22 22, FY23 18, FY24 14, FY25 11 (green bar).

Tax Rate Efficiency

In the world of fundamental analysis, most investors obsess over revenue growth, profit margins, and return ratios. These are important metrics, no doubt. But there is […]
+91-8448836436