Manish Goel

About Manish Goel
SEBI Registered Investment Adviser • Chartered Accountant
422 Articles Published
Manish Goel is a Chartered Accountant and the Founder of Multibagger Securities Research & Advisory Pvt. Ltd. (SEBI Registered Investment Adviser, INA100007736). A full-time value investor since 2010, he has helped thousands of investors build long-term wealth through quality stock picking and disciplined fundamental analysis.
May 8, 2026
Tversky & Kahneman's 1981 Asian Disease Problem proved that human preferences reverse under arithmetically identical framings. Indian retail data confirms the effect at industrial scale. Titan Biotech (BSE: 524717) FY25 disclosures publish nearly every material fact in two frames simultaneously — a corporate analogue of the dual-frame discipline the great investors have used for ninety years.
May 8, 2026
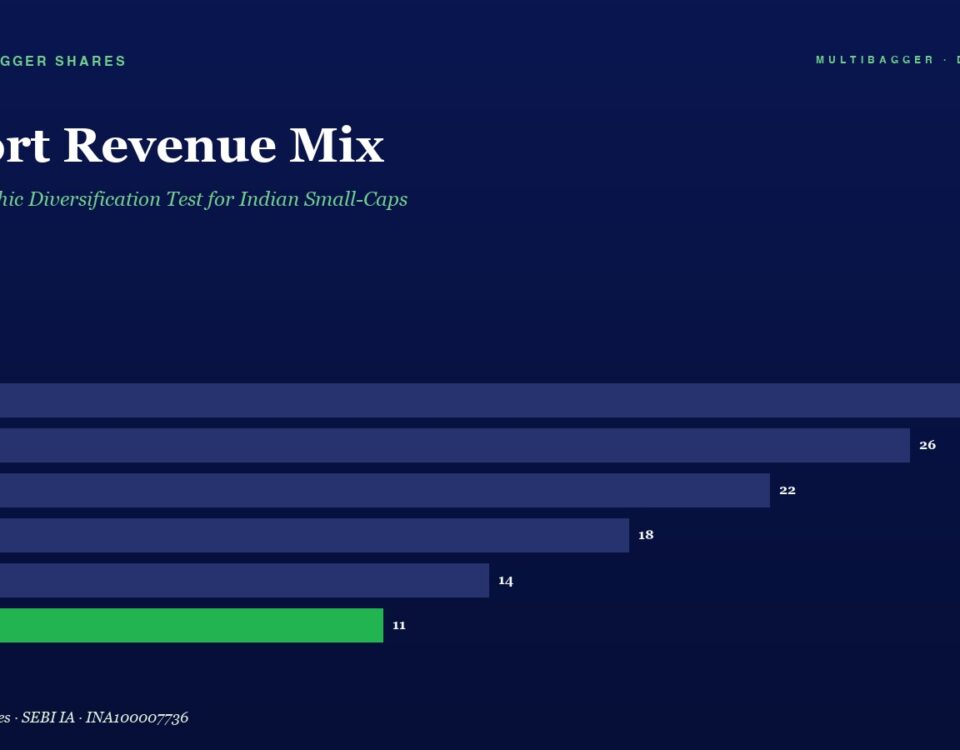
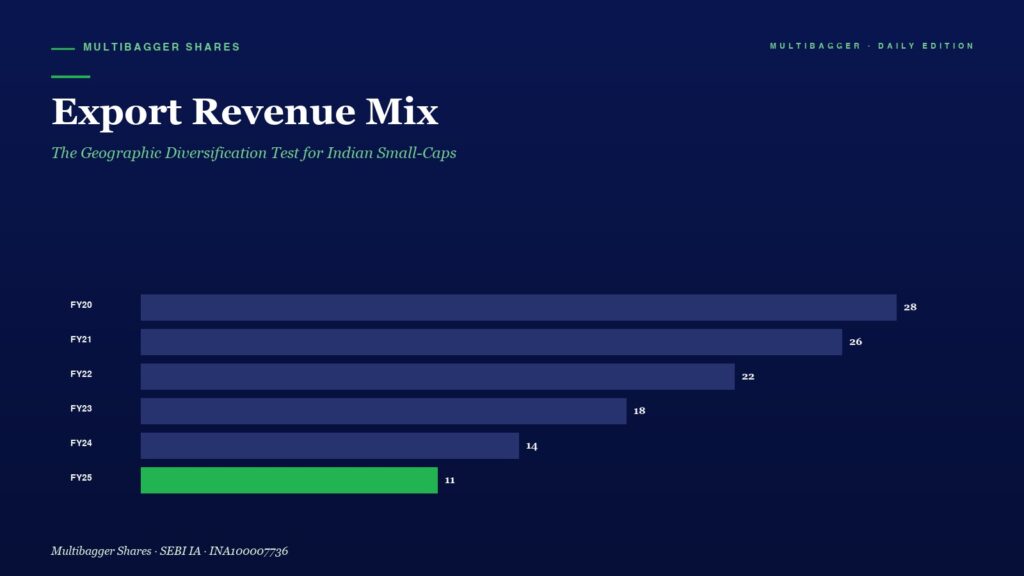
Export Revenue Mix isn't just a percentage — it's a forensic test for customer concentration, currency hedging, and pricing power against global benchmarks. Using Titan Biotech FY25's audited ~34.5% export share across 60+ countries as an educational illustration of disciplined geographic diversification.
May 7, 2026
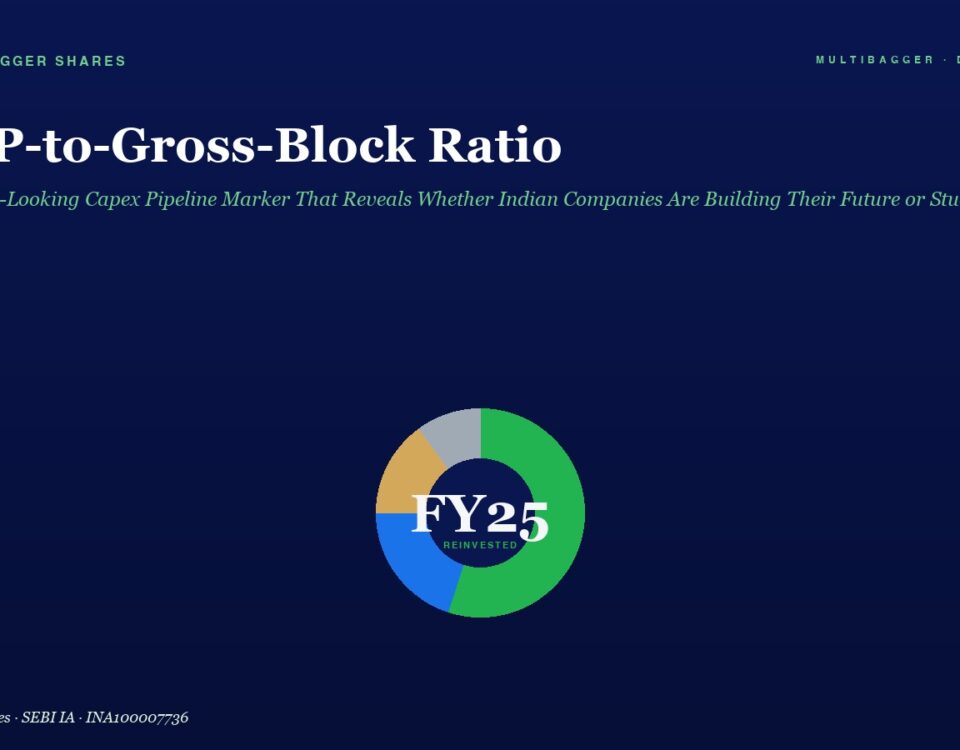
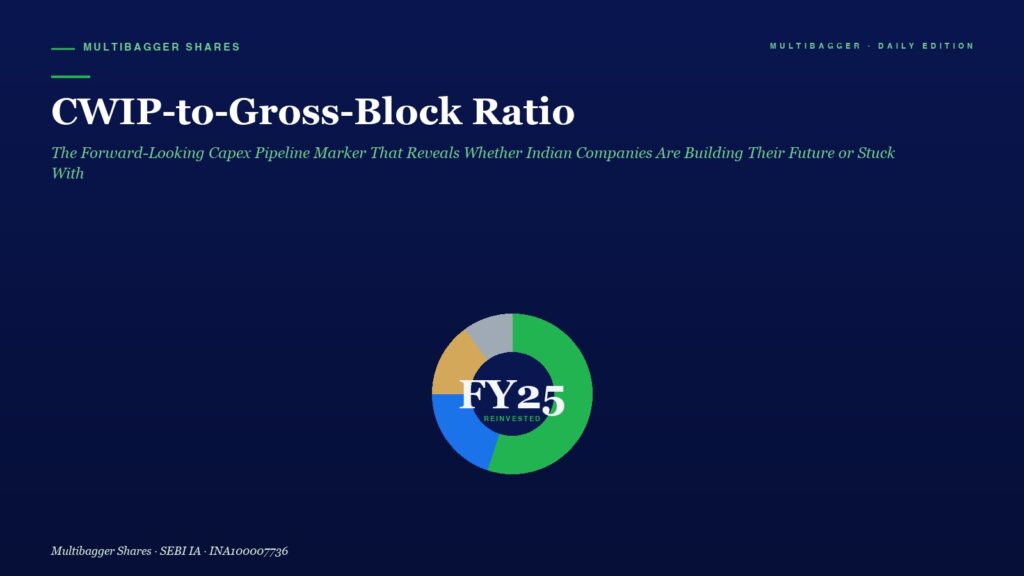
A forensic balance-sheet ratio every Indian long-term investor should master, illustrated with Titan Biotech FY25 audited markers (₹11 Cr CWIP, ₹57 Cr Gross Block, ₹3 Cr borrowings, 103% CFO/Operating Profit).
May 7, 2026
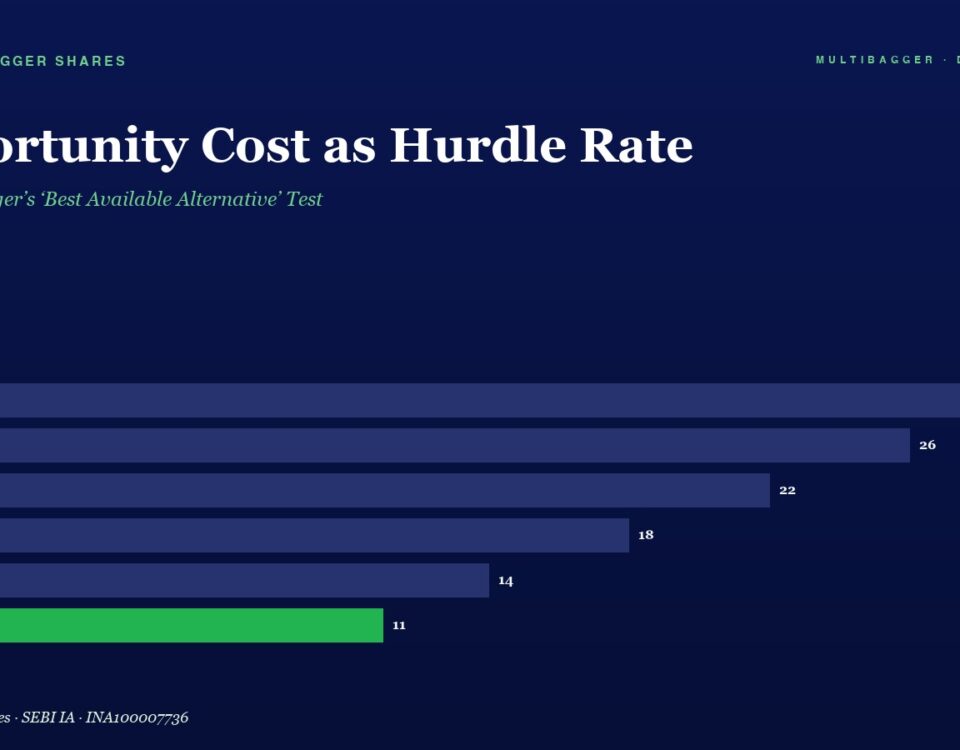
Charlie Munger's lifetime discipline: every rupee must beat the next-best alternative use, on a risk-adjusted basis. How Indian long-term investors apply the hurdle-rate test using the 10-year G-sec, and why Titan Biotech FY25's audited RoCE spread illustrates the discipline.