Track Record of Identifying Rare Wealth CreatorsTrack Record of Identifying Rare Wealth Creators
Manish Goel - SEBI Registered Investment Adviser

About Manish Goel

SEBI Registered Investment Adviser • Chartered Accountant

420 Articles Published

Manish Goel is a Chartered Accountant and the Founder of Multibagger Securities Research & Advisory Pvt. Ltd. (SEBI Registered Investment Adviser, INA100007736). A full-time value investor since 2010, he has helped thousands of investors build long-term wealth through quality stock picking and disciplined fundamental analysis.

March 25, 2026
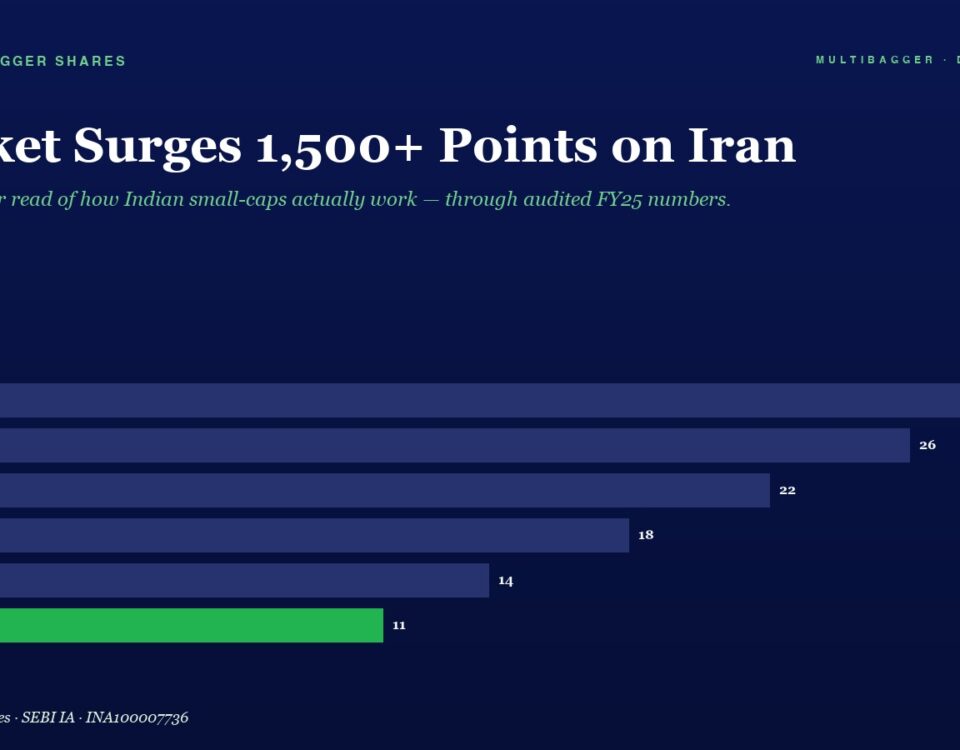
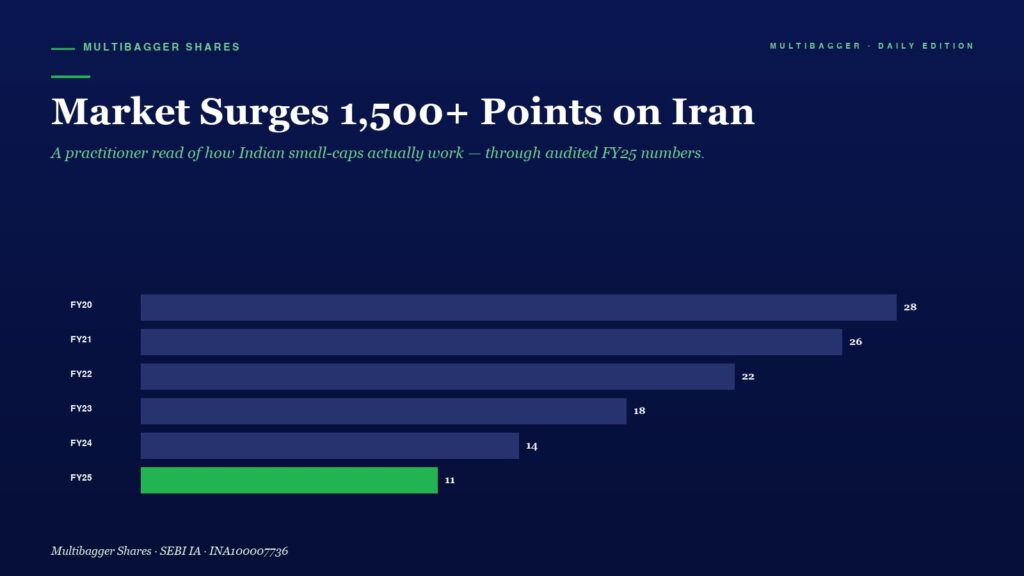
Infographic slide: dark blue background with title 'Market Surges 1,500+ Points on Iran' and a horizontal bar chart of yearly gains—FY20 28, FY21 26, FY22 22, FY23 18, FY24 14, FY25 11, with FY25 shown as a green bar.

Market Surges 1,500+ Points on Iran Peace Hopes — Why Smart Investors Stay Calm in Both Rallies and Crashes

Sensex surges 1,500+ points as Iran peace hopes boost sentiment. Learn why value investors stay calm in both rallies and crashes. Titan Biotech continues to compound. Stay away from F&O.
March 25, 2026
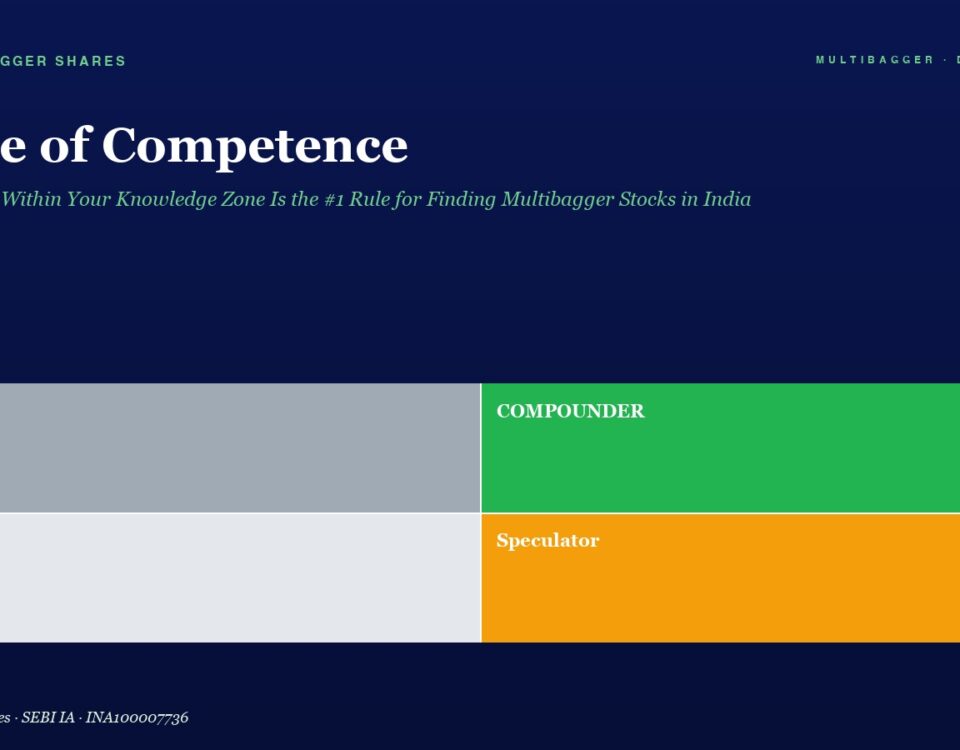
Hero banner with Circle of Competence title and subtitle, plus a 2x2 color grid: Trader (gray), Compounder (green), Drift (light gray), Speculator (orange).

Circle of Competence: Why Staying Within Your Knowledge Zone Is the #1 Rule for Finding Multibagger Stocks in India

📅 Published March 25, 2026 (Wednesday) Table of Contents Toggle Introduction: The Most Ignored Rule in Investing What Exactly Is the Circle of Competence? Real-World Proof: […]
March 25, 2026
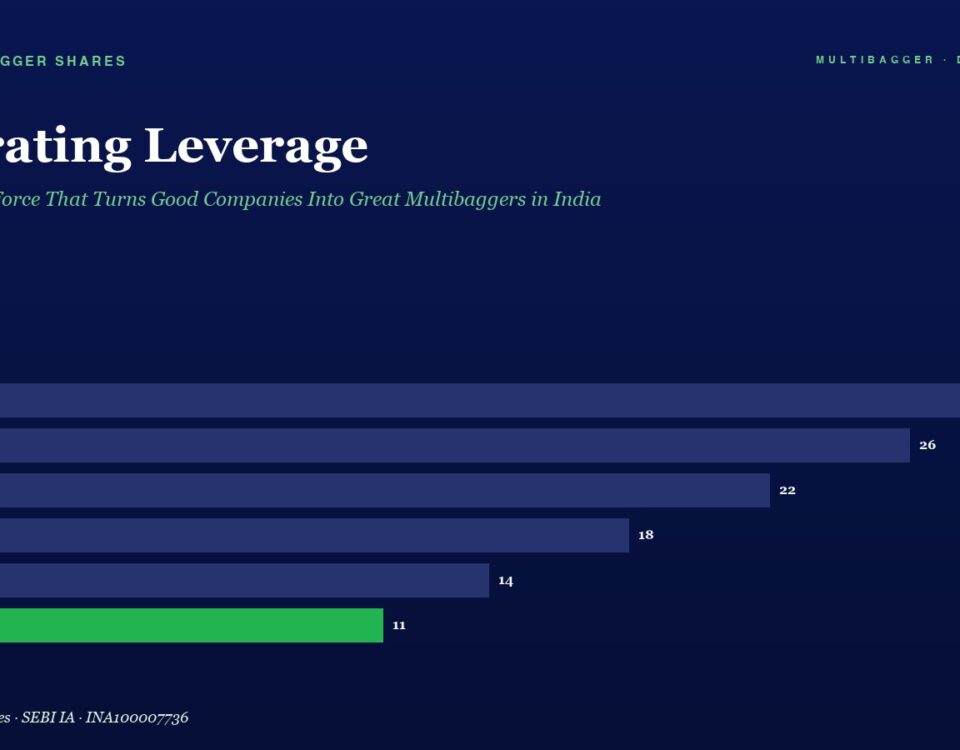
Horizontal bar chart labeled Operating Leverage, showing FY20–FY25 values; purple bars with 28, 26, 22, 18, 14 and a green bar at 11 for FY25.

Operating Leverage: The Hidden Force That Turns Good Companies Into Great Multibaggers in India

📅 Published March 25, 2026 (Wednesday) Table of Contents Toggle Why Some Companies Explode in Profits While Others Barely Grow What Is Operating Leverage? A Simple […]
March 25, 2026
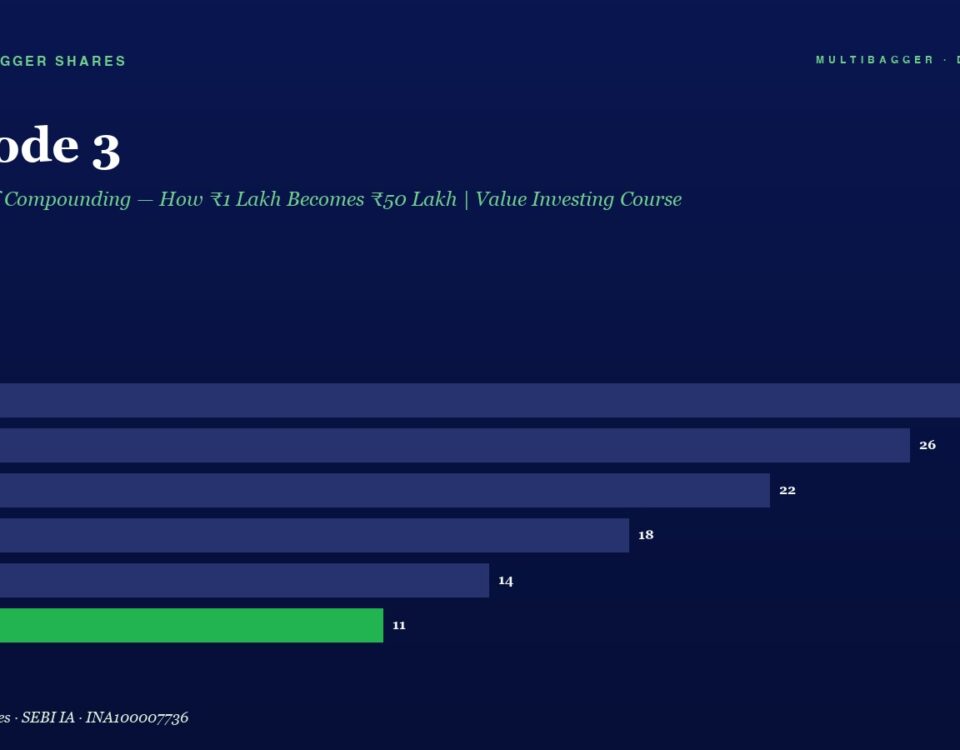
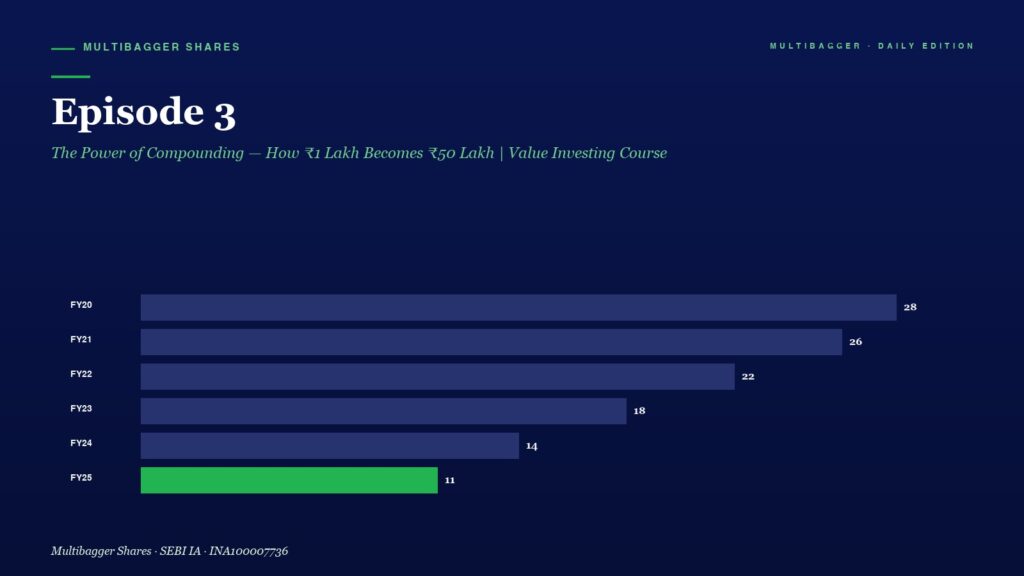
Hero section featuring Episode 3 with subtitle 'The Power of Compounding — How ₹1 Lakh Becomes ₹50 Lakh | Value Investing Course' and a horizontal bar chart of year-by-year values from FY20 to FY25; values descend from 28 to 11, with FY25 highlighted in green.

Episode 3: The Power of Compounding — How ₹1 Lakh Becomes ₹50 Lakh | Value Investing Course

📅 Published March 25, 2026 (Wednesday) Welcome to Episode 3 of our Complete Value Investing Course for Indian Investors. In this episode, we explore the most […]
+91-7380122211