
Track Record of Identifying Rare Wealth CreatorsTrack Record of Identifying Rare Wealth Creators
Manish Goel - SEBI Registered Investment Adviser

About Manish Goel

SEBI Registered Investment Adviser • Chartered Accountant

448 Articles Published

Manish Goel is a Chartered Accountant and the Founder of Multibagger Securities Research & Advisory Pvt. Ltd. (SEBI Registered Investment Adviser, INA100007736). A full-time value investor since 2010, he writes on value-investing principles for education and general awareness.

May 30, 2026
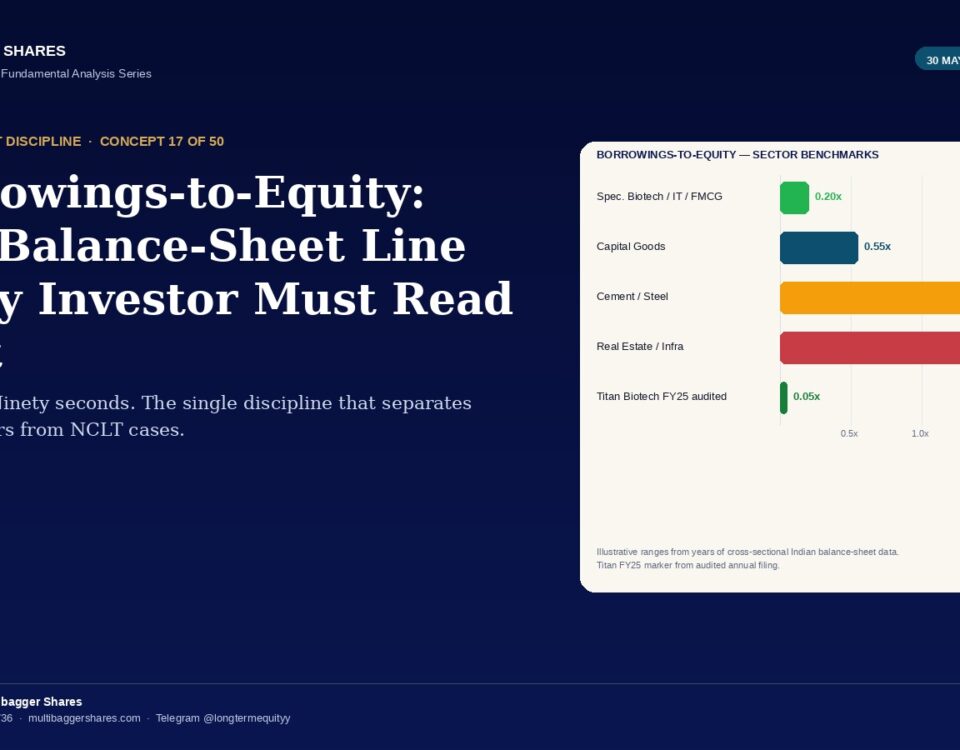
Borrowings-to-Equity ratio sector benchmarks editorial cover

Borrowings-to-Equity Ratio: How One Balance-Sheet Line Separates Capital-Disciplined Compounders From Leverage-Driven Time Bombs

One ratio. Ninety seconds. The single balance-sheet discipline that separates compounders from NCLT cases — explained with the Titan Biotech FY25 audited illustration.
May 29, 2026
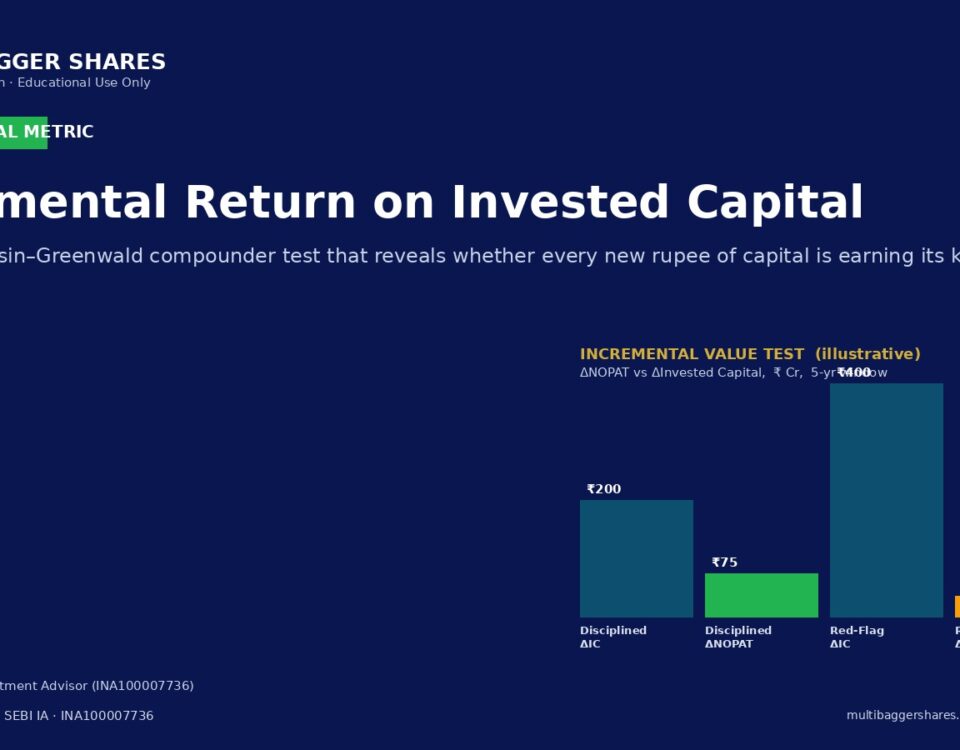
Slide titled Incremental Return on Invested Capital with a four-bar chart on a dark blue background.

Incremental Return on Invested Capital: The Mauboussin-Greenwald Compounder Test That Reveals Whether Every New Rupee of Capital Earns Its Keep

Headline RoIC describes legacy capital; Incremental RoIC describes the most recent rupees deployed. The Mauboussin-Greenwald compounder test, explained step-by-step with audited Indian disclosures.
May 28, 2026
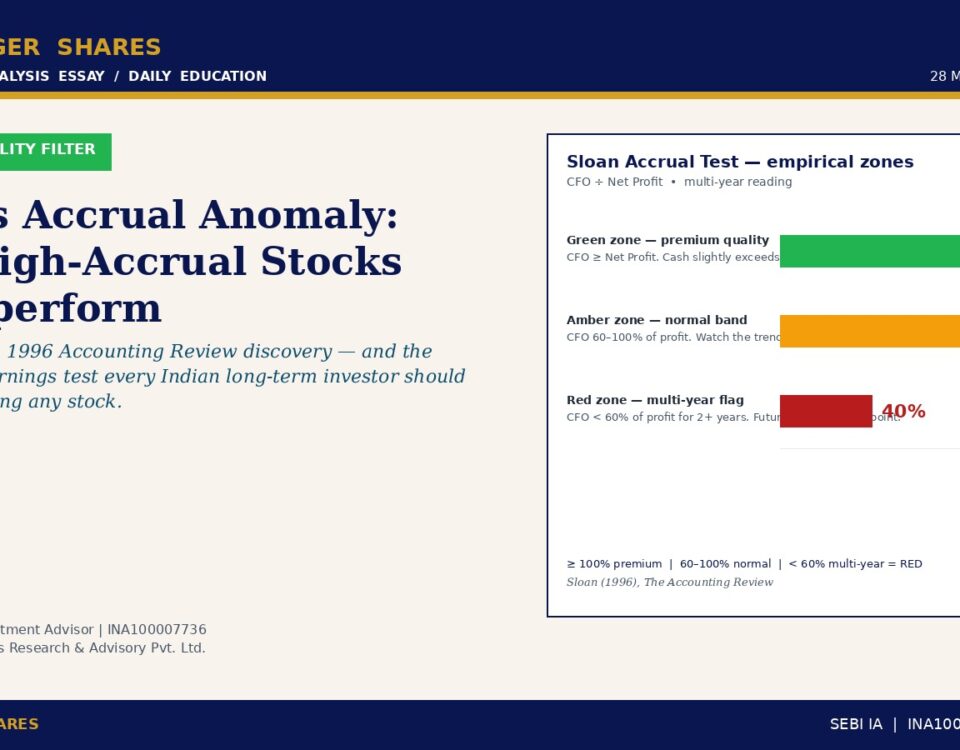
Article header: Sloan's Accrual Anomaly: Why High-Accrual Stocks Underperform, with intro paragraph and author byline on a beige page.

Sloan’s Accrual Anomaly: The 1996 Accounting Review Discovery That High-Accrual Stocks Underperform — And Why the Cash-Backed Earnings Test Is the Single Most Powerful Forensic Filter for Indian Long-Term Investors

Richard Sloan 1996 Accounting Review discovery on high-accrual underperformance and the cash-backed earnings test for Indian long-term investors.
May 27, 2026
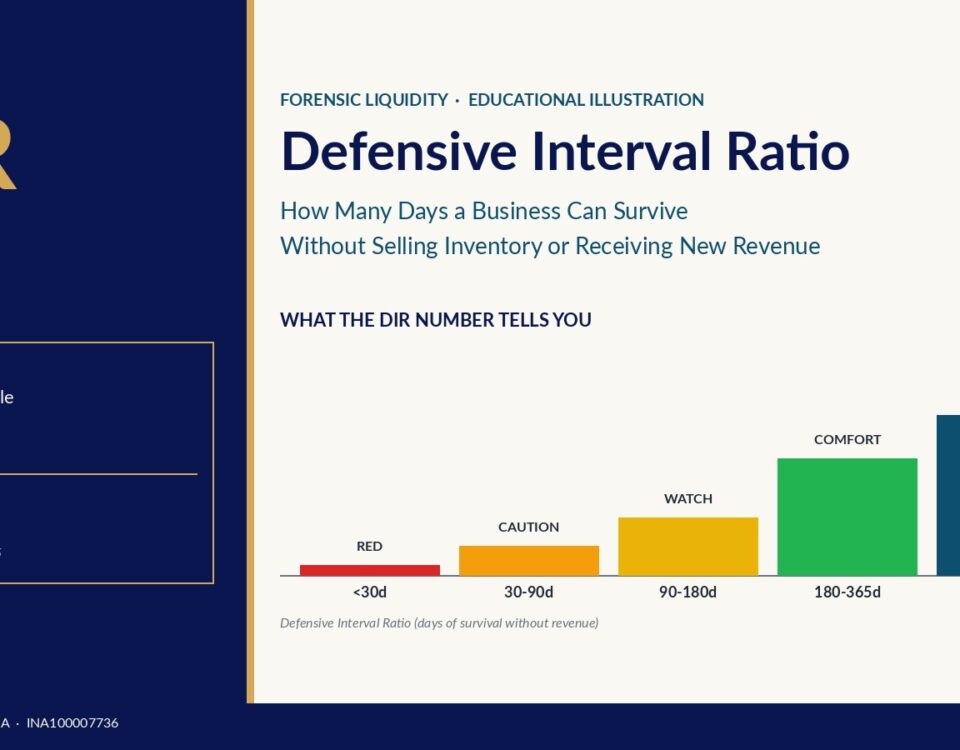
Left dark blue panel showing the DIR title and a box labeled Formula with cash, marketable securities and net receivables, plus daily operating cash outflow; right side presents a cream background infographic titled Defensive Interval Ratio with a five-bar chart (Red

Defensive Interval Ratio: The Forensic Liquidity Metric That Reveals How Many Days a Business Can Survive Without Selling Inventory or Receiving New Revenue

How to read the Defensive Interval Ratio — the forensic liquidity metric that counts days of survival without selling inventory or receiving new revenue, illustrated with audited FY25 markers from a disciplined Indian specialty-biotech operator.
WhatsApp +91-7380122211