Your blog category

April 11, 2026
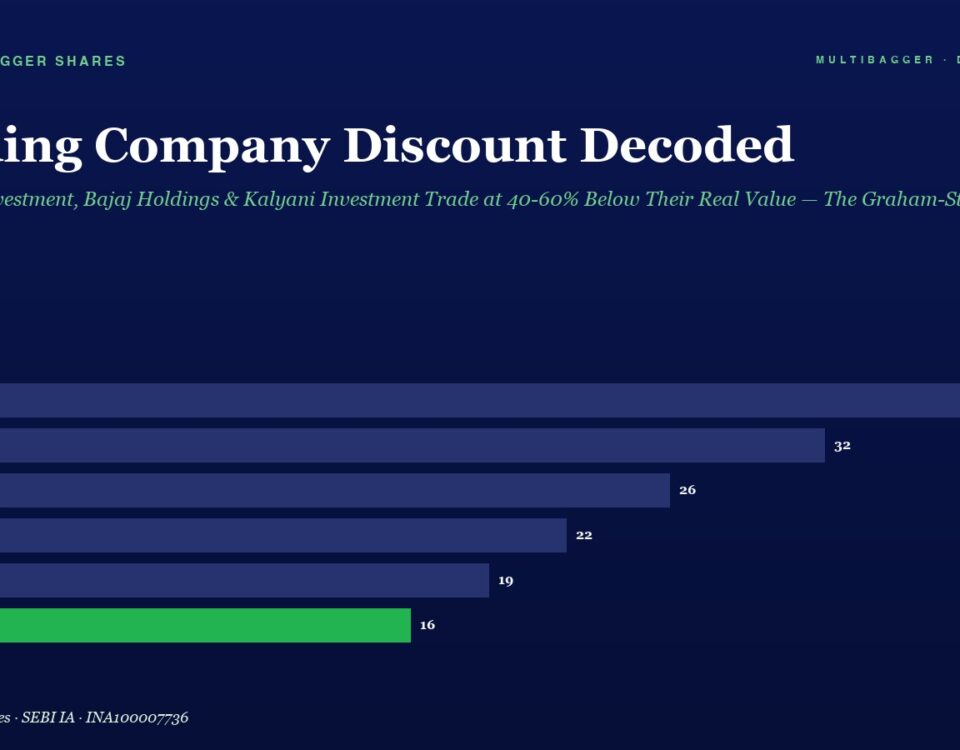
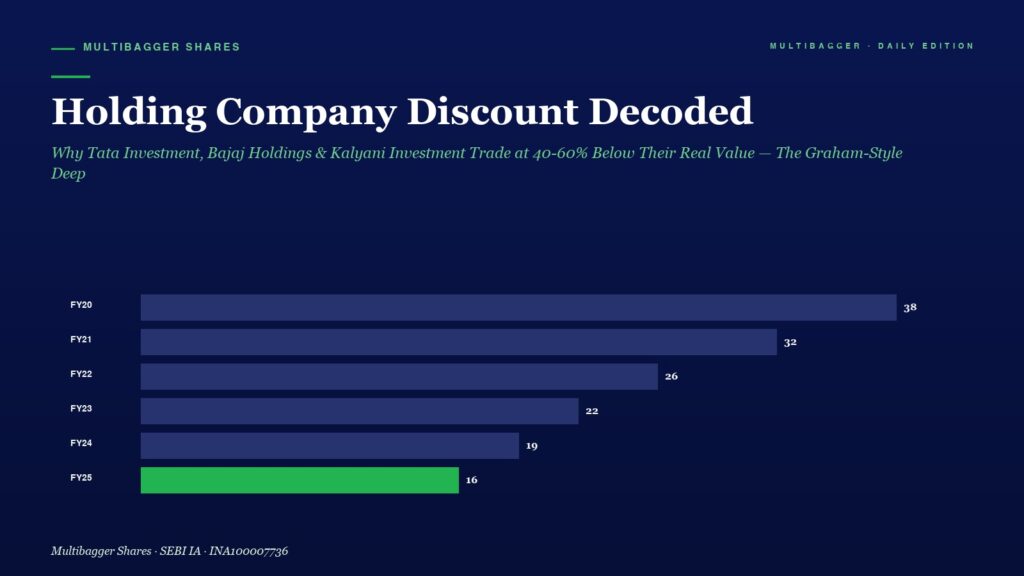
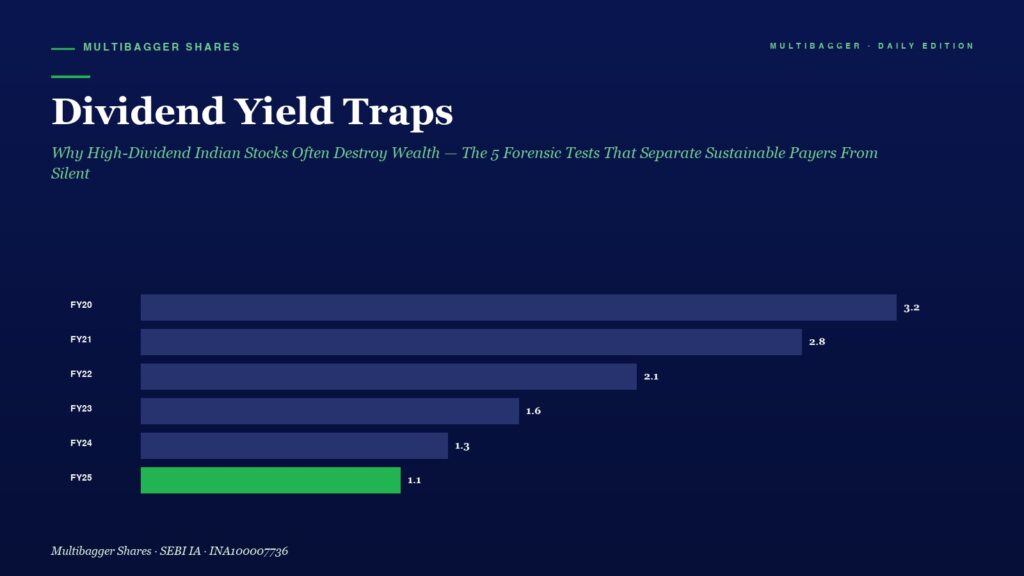
Infographic bar chart showing holding company discount from FY20 to FY25, decreasing from 38% to 16% with FY25 highlighted in green (16%). For context title: Holding Company Discount Decoded.

Holding Company Discount Decoded: Why Tata Investment, Bajaj Holdings & Kalyani Investment Trade at 40-60% Below Their Real Value — The Graham-Style Deep Value Opportunity Hiding in Plain Sight on the Indian Stock Market

Discover why Indian holding companies like Tata Investment, Bajaj Holdings, and Kalyani Investment trade at 40-60% discounts to their real NAV — and the step-by-step framework smart value investors use to separate genuine bargains from permanent value traps.
April 11, 2026
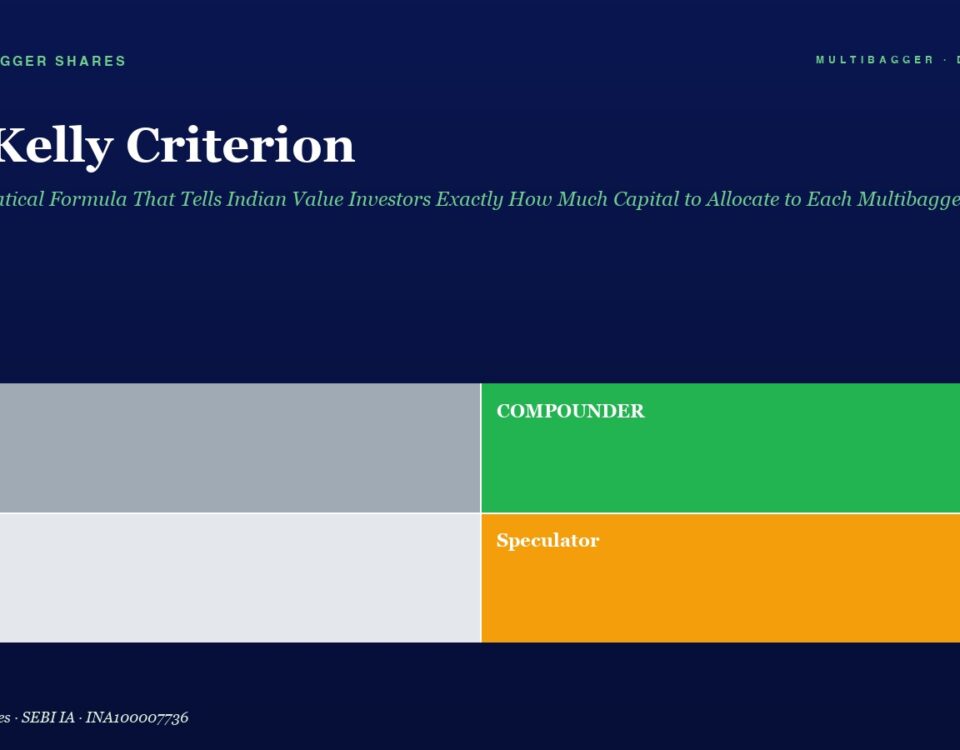
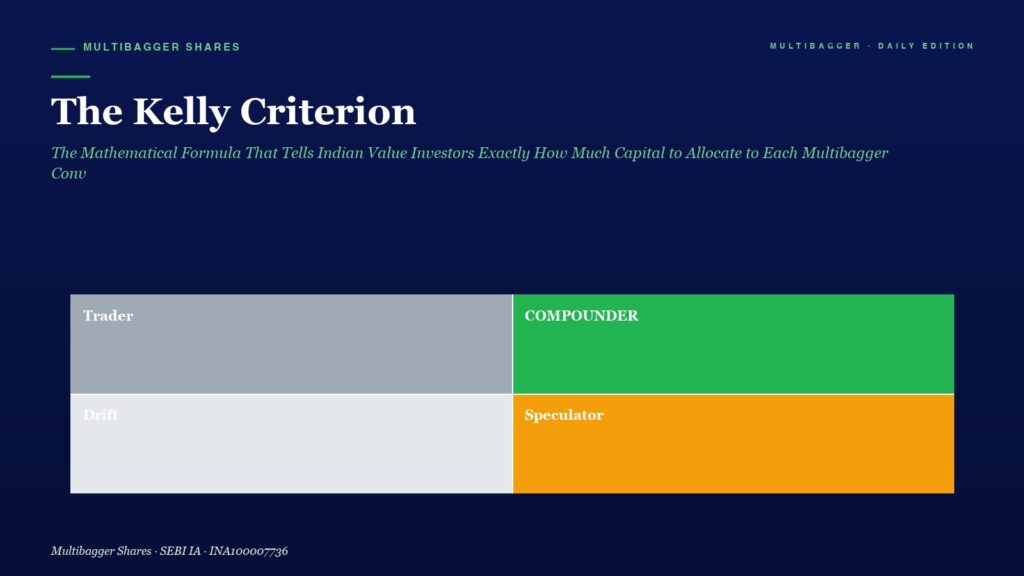
Hero header with title 'The Kelly Criterion' and green subtitle; four-color quadrant infographic labeled Trader (gray), Compounder (green), Drift (light gray), Speculator (orange) on a navy background.

The Kelly Criterion: The Mathematical Formula That Tells Indian Value Investors Exactly How Much Capital to Allocate to Each Multibagger Conviction — How Edward Thorp, Warren Buffett, and Charlie Munger Use This Bet-Sizing Secret to Compound Wealth Faster Than Anyone Else

Stock picking is only half the battle — bet sizing is the other half. Discover how the Kelly Criterion, the mathematical formula used by Warren Buffett, Charlie Munger, Edward Thorp and Mohnish Pabrai, tells you exactly how much capital to allocate to each high-conviction multibagger. The math behind concentrated investing decoded for Indian value investors.
April 11, 2026
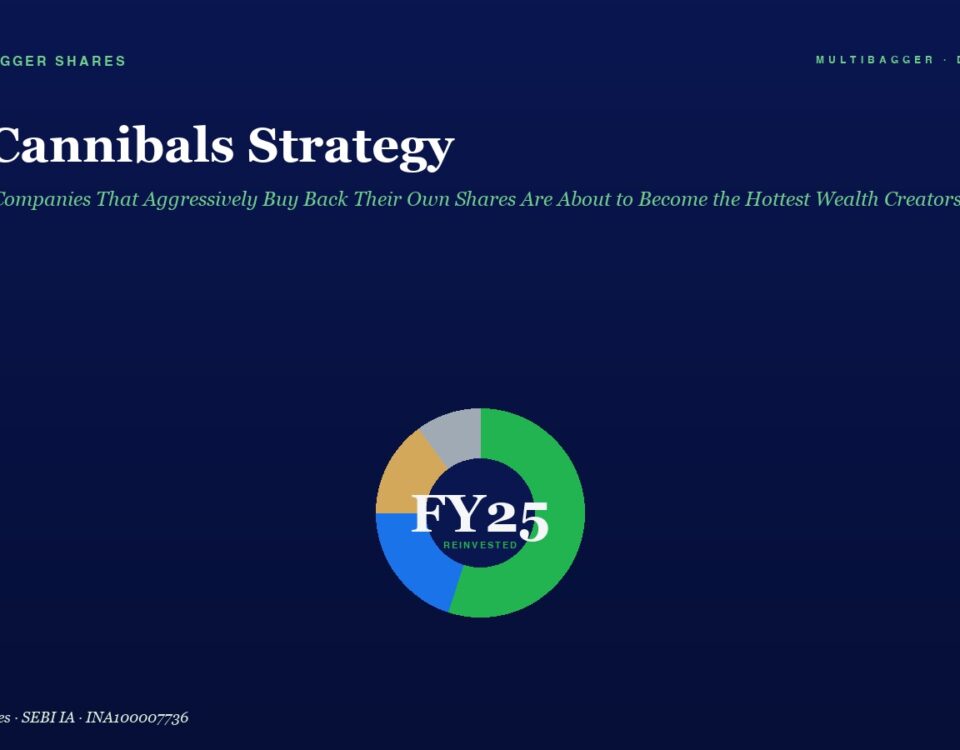
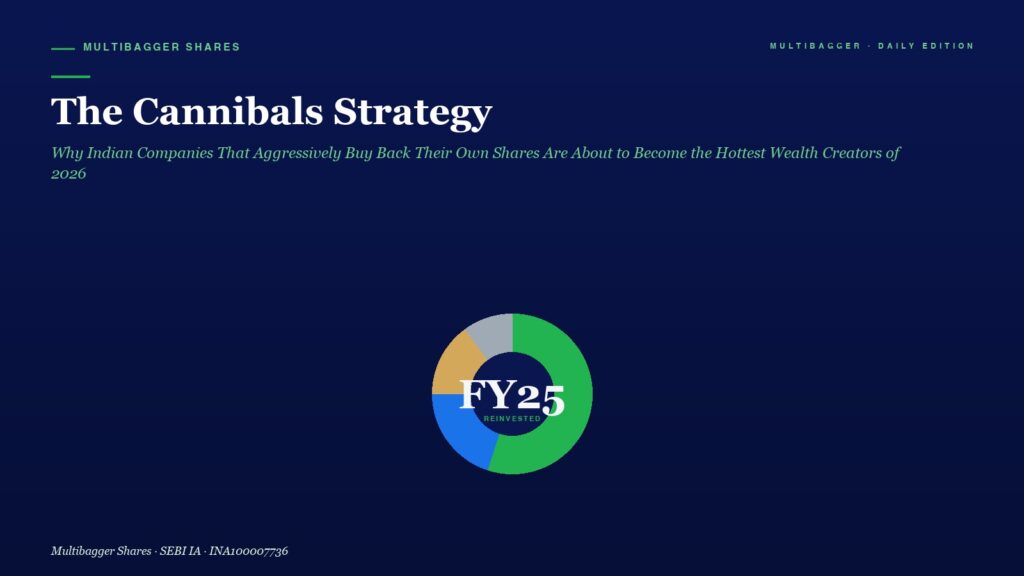
Headline: The Cannibal's Strategy with a subtitle about aggressive share buybacks and a circular FY25 chart below on a dark blue background.

The Cannibals Strategy: Why Indian Companies That Aggressively Buy Back Their Own Shares Are About to Become the Hottest Wealth Creators of 2026 — How Smart Value Investors Can Profit From SEBI’s New Buyback Tax Regime Before the Crowd Wakes Up

📅 Published April 11, 2026 (Saturday) The Cannibals Are Coming Back — And Indian Value Investors Need to Pay Attention Right Now On April 2, 2026, […]
April 11, 2026
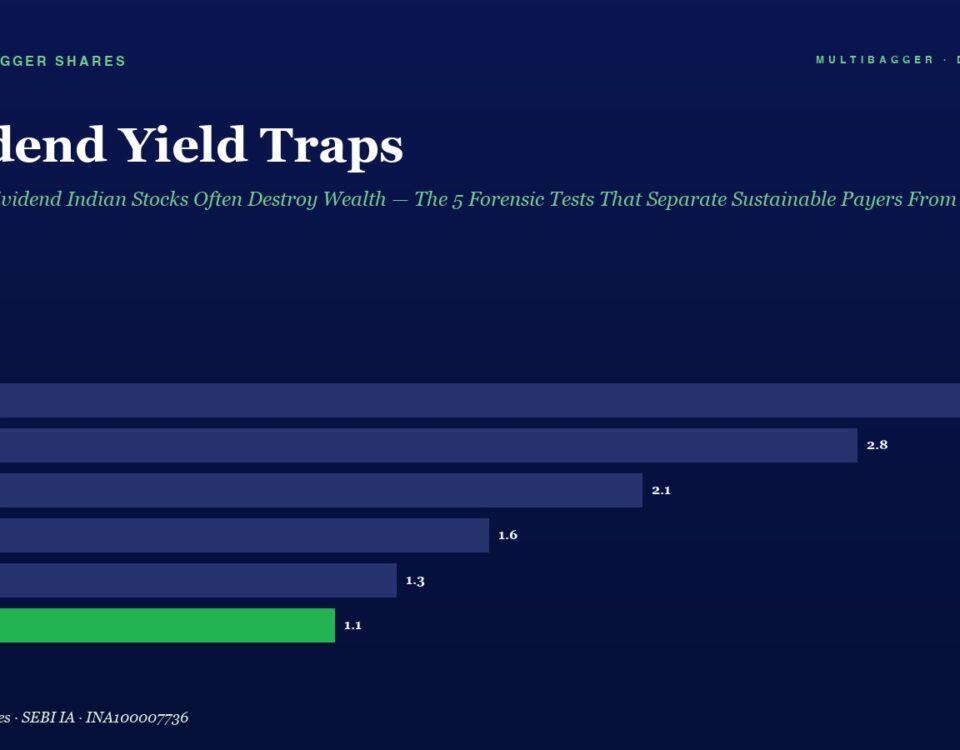
Hero image for an article titled 'Dividend Yield Traps' with a subtitle about high-dividend Indian stocks, featuring a dark blue horizontal bar chart of FY20–FY25. Bars show FY20 3.2%, FY21 2.8%, FY22 2.1%, FY23 1.6%, FY24 1.3%, and FY25 1.1% (green). Top-left label 'MULTIBAGGER SHARES', top-right 'MULTIBAGGER · DAILY EDITION'.

Dividend Yield Traps: Why High-Dividend Indian Stocks Often Destroy Wealth — The 5 Forensic Tests That Separate Sustainable Payers From Silent Portfolio Killers

A deep dive into dividend yield traps in Indian markets: why an 8%+ yield is almost always a warning siren, how PSU, cyclical, and zombie-business traps work, and the 5 forensic tests every value investor must use before buying any dividend stock.
+91-8448836436