Your blog category

March 26, 2026
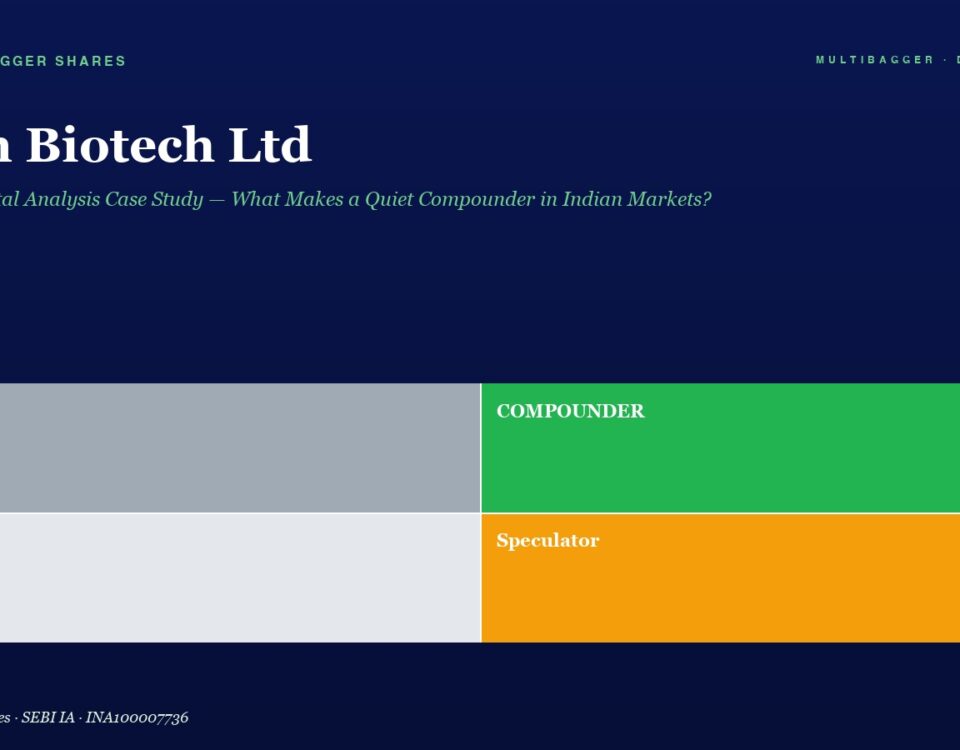
Header for article 'The Art of Scuttlebutt' with a two-by-two color grid labeled Trader, Compounder, Drift, and Speculator.

The Art of Scuttlebutt: Philip Fisher’s 15-Point Checklist for Finding India’s Next Multibagger Stocks

Philip Fisher's legendary Scuttlebutt Method and 15-Point Checklist remain the gold standard for finding multibagger stocks. Learn how to apply these timeless principles to identify quality companies in the Indian stock market — with real examples including Titan Biotech's 200%+ journey.
March 26, 2026
Dark blue hero image with the title 'Geopolitical Crises and Your Portfolio' and a horizontal bar chart of FY20–FY25 values (28, 26, 22, 18, 14, 11); FY25 bar is bright green.

Geopolitical Crises and Your Portfolio: Why Smart Value Investors Buy When Others Panic — Lessons from India’s Market History

📅 Published March 26, 2026 (Thursday) Table of Contents Toggle When the World Panics, the Wise Invest The Historical Pattern: Every Crisis is a Buying Opportunity […]
March 26, 2026
Infographic: Ram Navami Special headline with a fiscal bar chart showing yearly values from FY20 to FY25, final FY25 in green (11).

Ram Navami Special: Markets Closed Today — What Yesterday’s 1,200-Point Sensex Rally Means for Your Portfolio

📅 Published March 26, 2026 (Thursday) 🪔 Ram Navami Holiday Edition Markets Closed Today Table of Contents Toggle Market Snapshot — Last Session: Wednesday, March 25, […]
March 26, 2026
Infographic: The PEG Ratio Explained with horizontal bars for FY20–FY25; values drop from 38 to 16, with FY25 bar in green and a title/subtitle at top.

The PEG Ratio Explained: Peter Lynch’s Secret Weapon for Finding Undervalued Growth Stocks in India

📅 Published March 26, 2026 (Thursday) Table of Contents Toggle Why the P/E Ratio Alone Can Mislead You What Is the PEG Ratio? Why the PEG […]
+91-8448836436