Track Record of Identifying Rare Wealth CreatorsTrack Record of Identifying Rare Wealth Creators

Your blog category

March 18, 2026
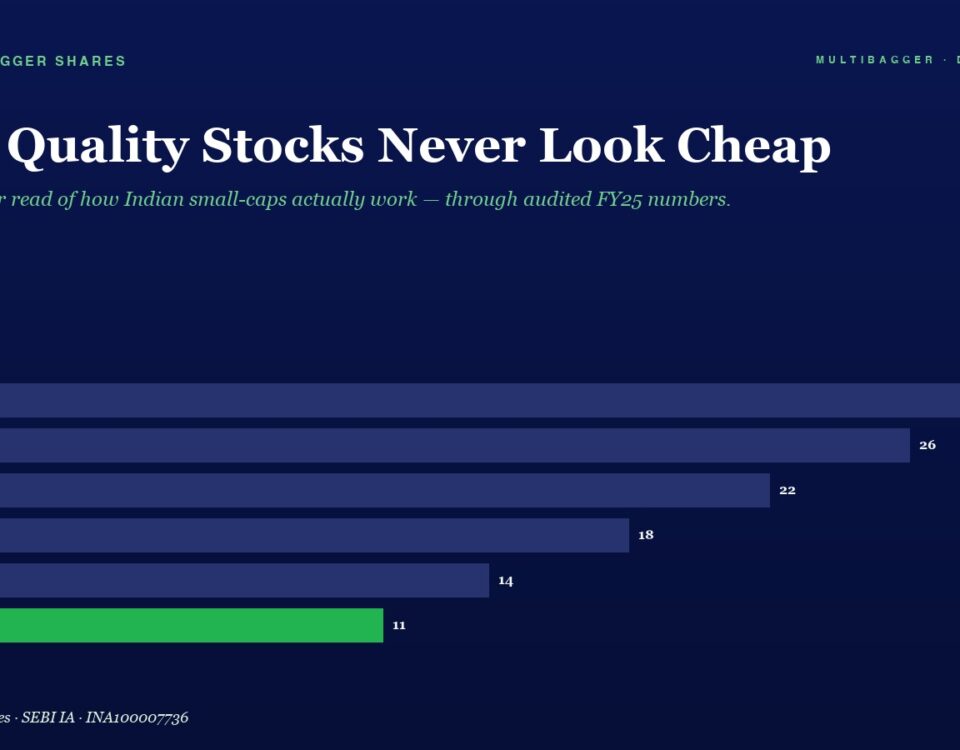
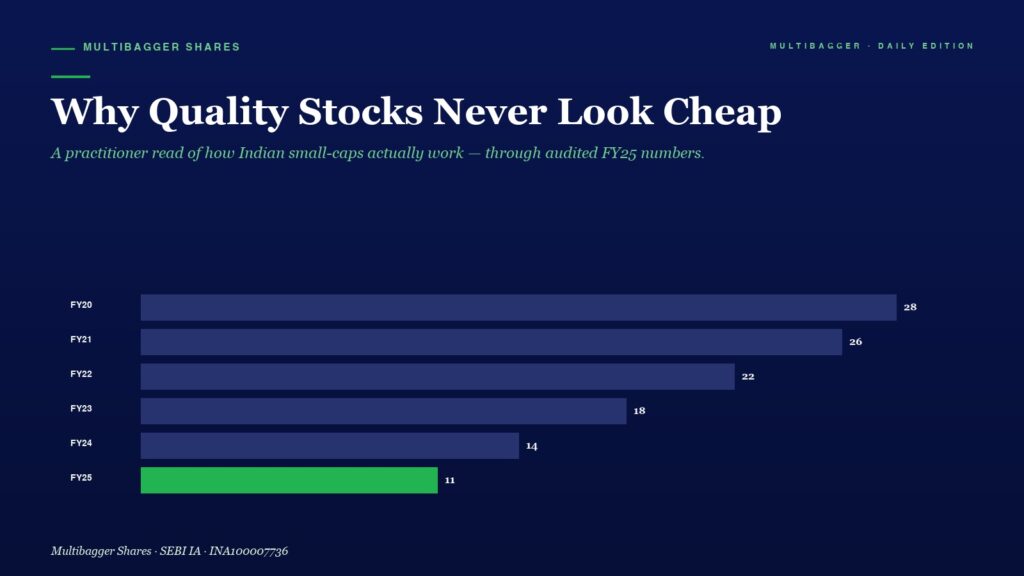
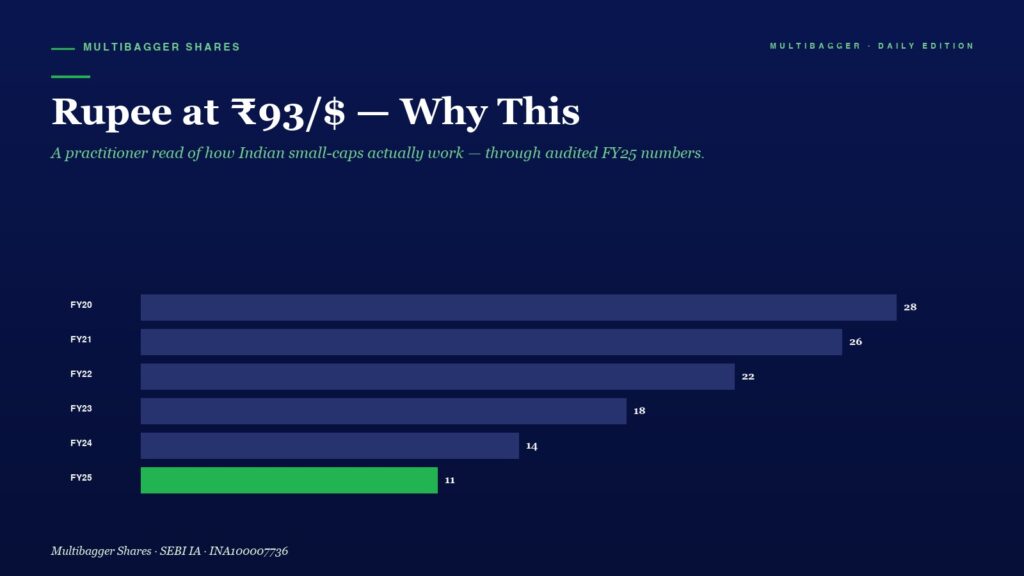
Infographic titled 'Why Quality Stocks Never Look Cheap' showing a horizontal bar chart of FY20 to FY25 values; bars decrease from 28 to 11, with FY25 highlighted in green.

Why Quality Stocks Never Look Cheap — And Why That’s Actually a Good Sign

📅 Published March 18, 2026 (Wednesday) Table of Contents Toggle The Value Trap Epidemic: Why Most “Cheap” Stocks Destroy Wealth What Actually Makes a Stock “Quality”? […]
March 18, 2026
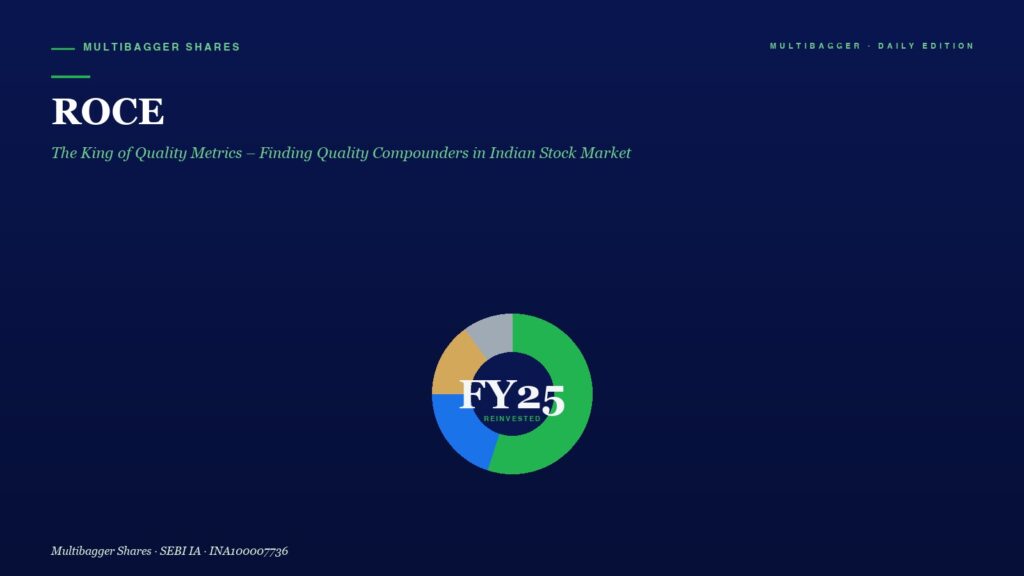
Hero section with ROCE title and green subtitle on a deep blue gradient; a multicolor donut chart labeled FY25 reinvested sits in the center.

ROCE: The King of Quality Metrics – Finding Quality Compounders in Indian Stock Market

📅 Published March 18, 2026 (Wednesday) Table of Contents Toggle ROCE: The King of Quality Metrics in Value Investing What is ROCE? Why ROCE Matters More […]
March 17, 2026
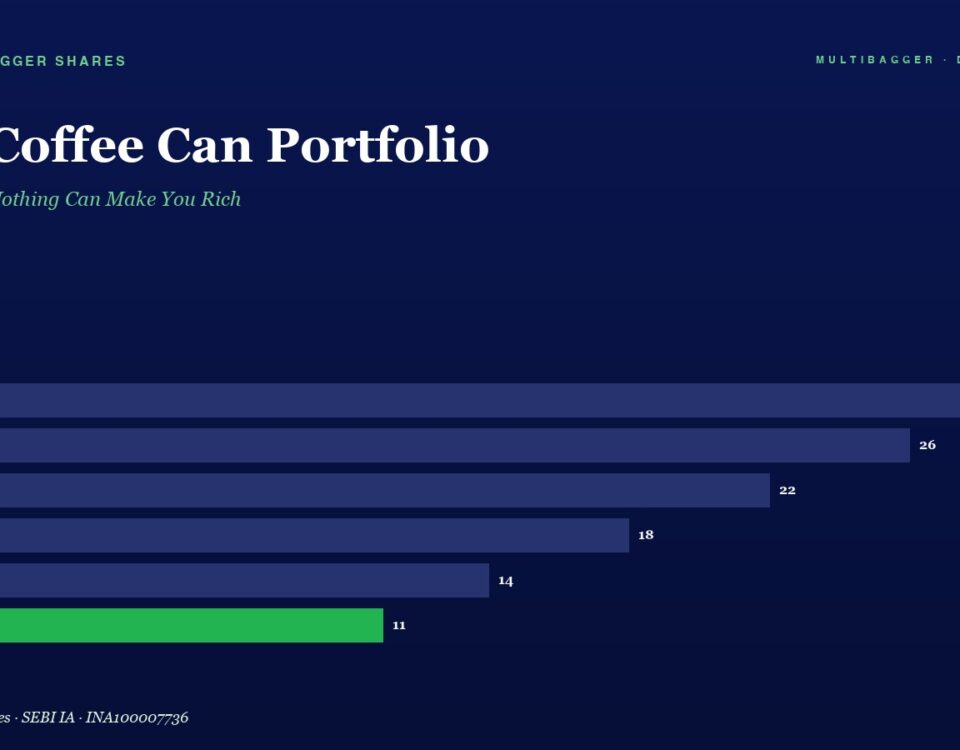
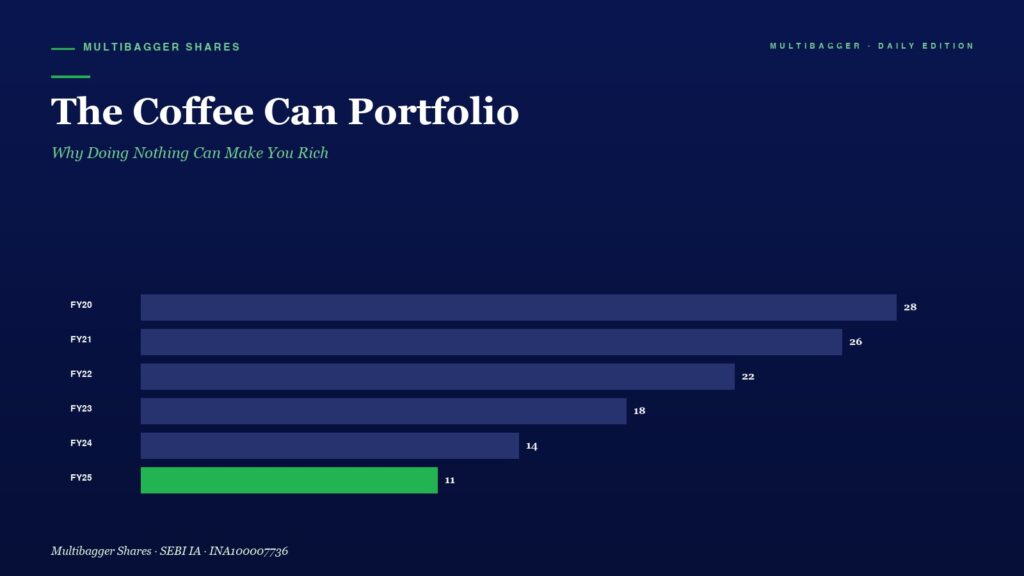
Bar chart titled The Coffee Can Portfolio showing yearly values FY20–FY25: 28, 26, 22, 18, 14, with FY25 value 11 in a green bar highlight

The Coffee Can Portfolio: Why Doing Nothing Can Make You Rich

📅 Published March 17, 2026 (Tuesday) Table of Contents Toggle What If the Best Investment Strategy Is to Do Absolutely Nothing? The Origin of the Coffee […]
March 16, 2026
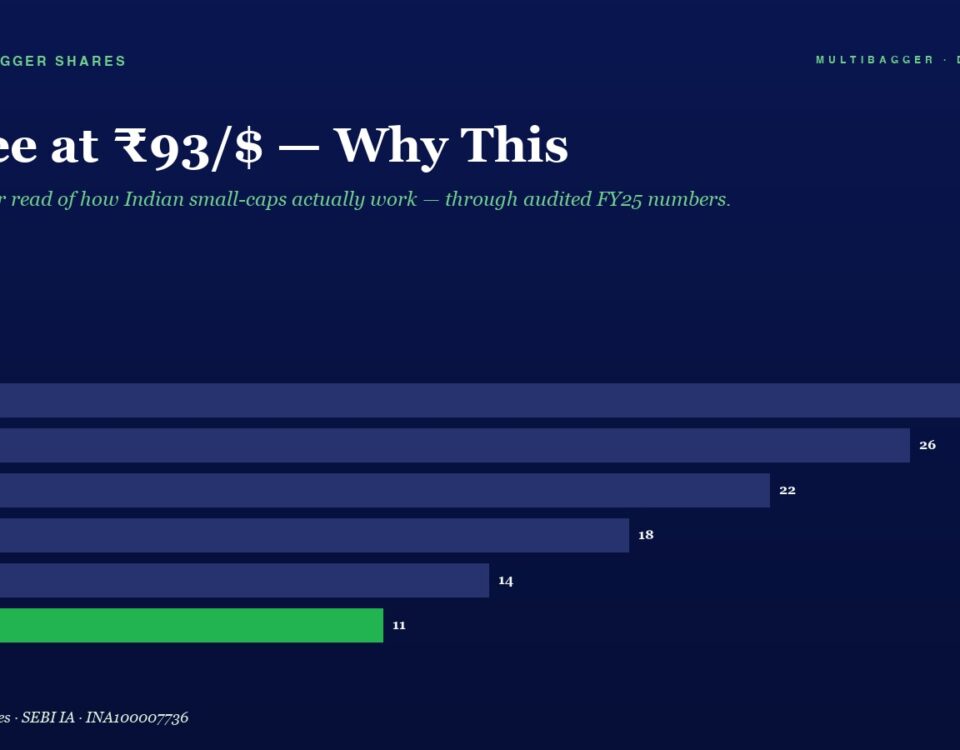
Hero section: article title about Rupee until ₹93/$; subtitle in italics; includes a horizontal bar chart showing FY20–FY25 values, with the final bar highlighted in green (11 in FY25).

Rupee at ₹93/$ — Why This Is a Golden Opportunity for Pharma & Biotech Investors

The Indian Rupee has depreciated to ~93 per US Dollar. While headlines scream doom, smart investors see this as a powerful tailwind for India's $30B+ pharma export engine. India is the Pharmacy of the World — and a weaker rupee makes it even more competitive. Here's why pharma & biotech stocks are the biggest beneficiaries.
+91-7380122211