Track Record of Identifying Rare Wealth CreatorsTrack Record of Identifying Rare Wealth Creators

Your blog category

March 21, 2026
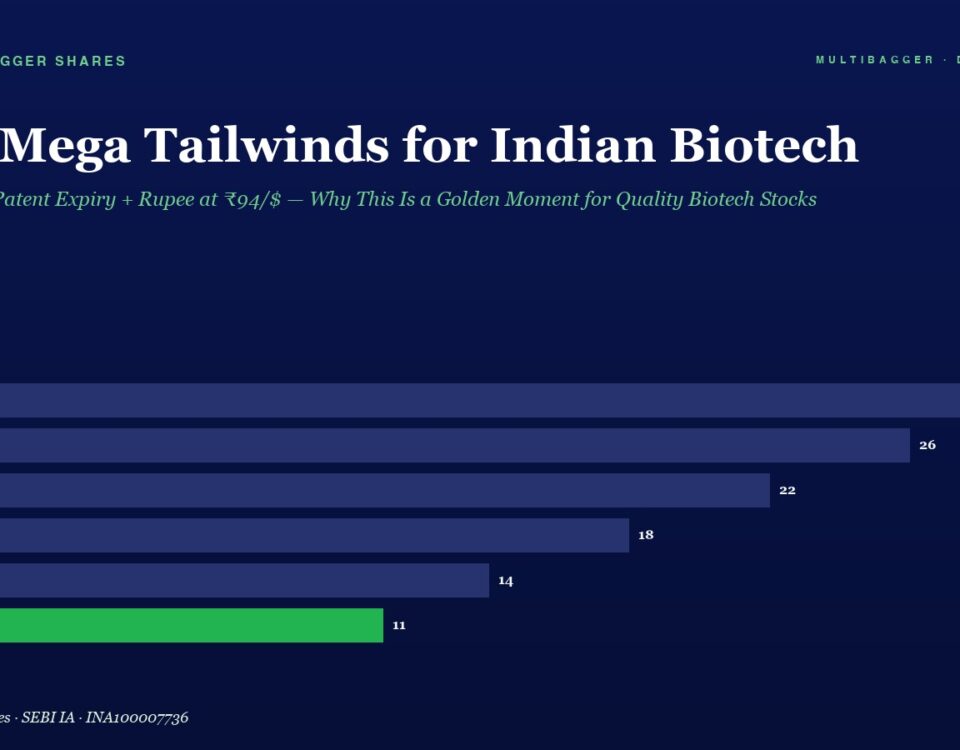
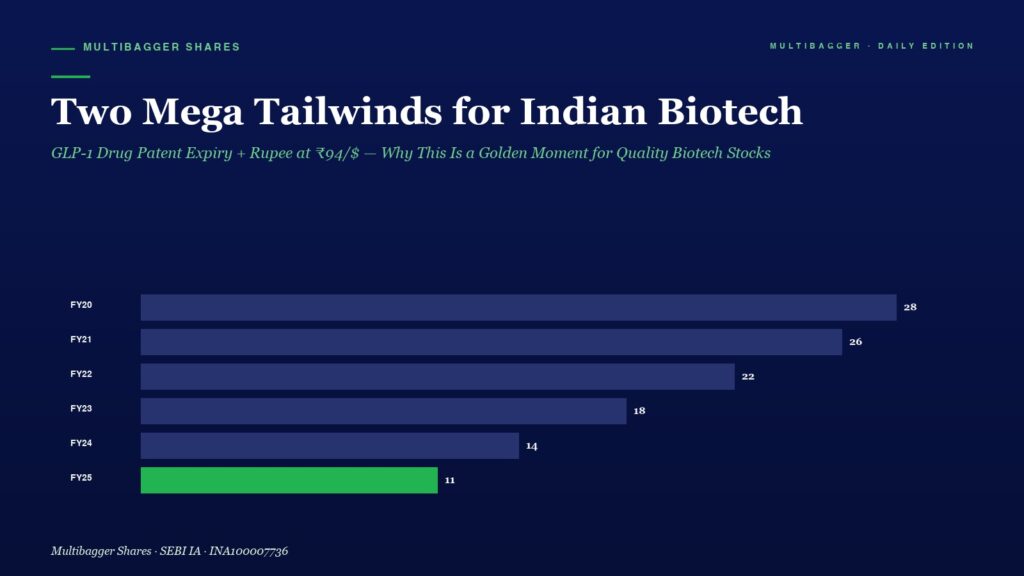
Infographic with a dark blue background showing the headline 'Two Mega Tailwinds for Indian Biotech' and a horizontal bar chart of yearly figures FY20–FY25; bars are purple except FY25, which is green, with values 28, 26, 22, 18, 14, and 11 (FY25). They convey the article's charted data.

Two Mega Tailwinds for Indian Biotech: GLP-1 Drug Patent Expiry + Rupee at ₹94/$ — Why This Is a Golden Moment for Quality Biotech Stocks

📅 Published March 21, 2026 (Saturday) Table of Contents Toggle Two Seismic Developments. One Massive Opportunity. Development #1: GLP-1 Drug Patent Expires in India Development #2: […]
March 21, 2026
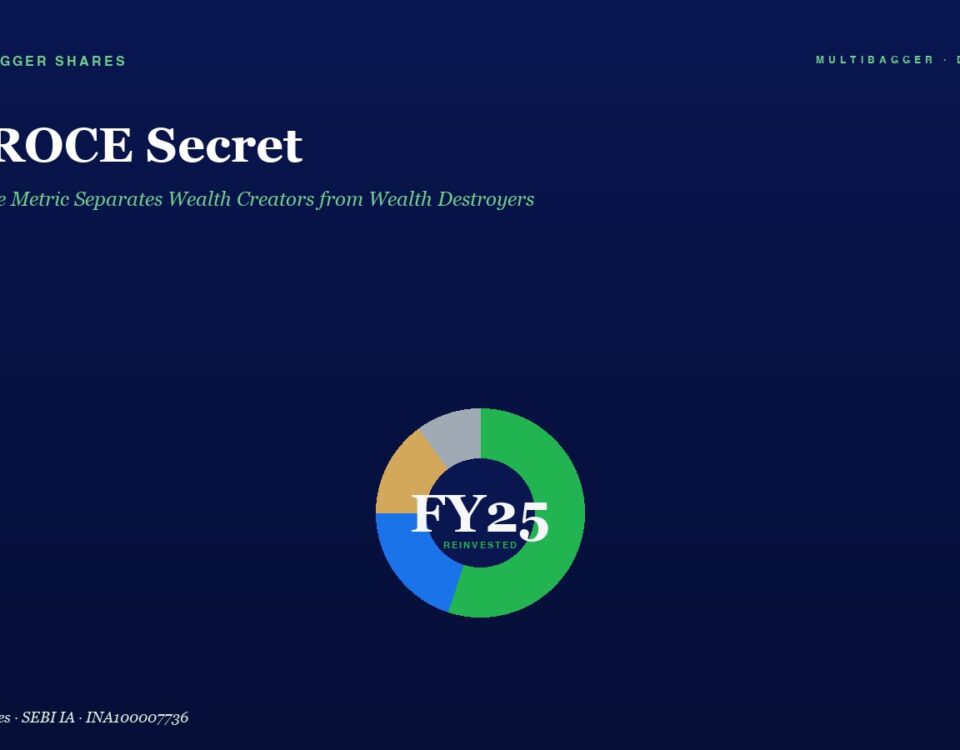
Header with title 'The ROCE Secret' and green italic subtitle on a dark blue gradient; a multicolored circular chart labeled FY25 REINVESTED sits centered.

The ROCE Secret: Why This One Metric Separates Wealth Creators from Wealth Destroyers

📅 Published March 21, 2026 (Saturday) Table of Contents Toggle The ROCE Secret: Why This One Metric Separates Wealth Creators from Wealth Destroyers What ROCE Actually […]
March 20, 2026
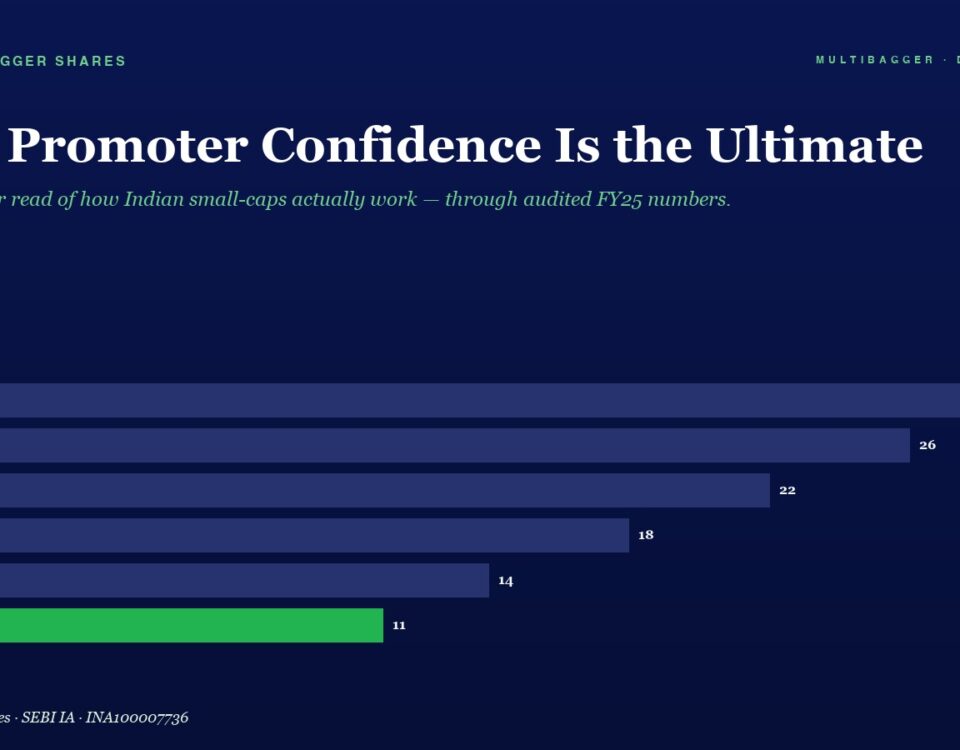
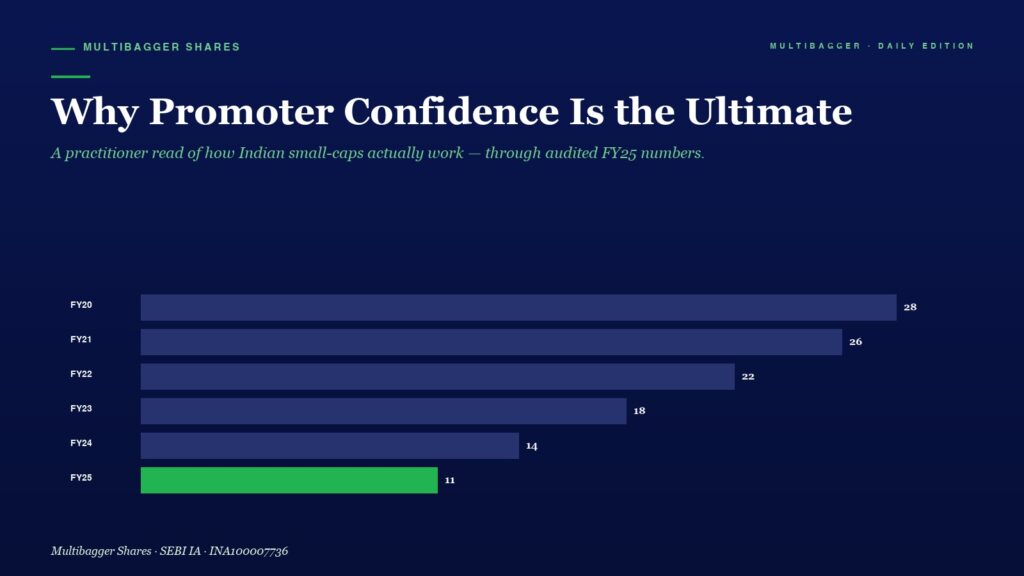
Horizontal bar chart of promoter confidence by fiscal year (FY20–FY25); FY25 is green at 11, others are 28, 26, 22, 18, 14.

Why Promoter Confidence Is the Ultimate Quality Signal

📅 Published March 20, 2026 (Friday) In the world of value investing, we often spend enormous time analysing balance sheets, income statements, and cash flow trends. […]
March 20, 2026
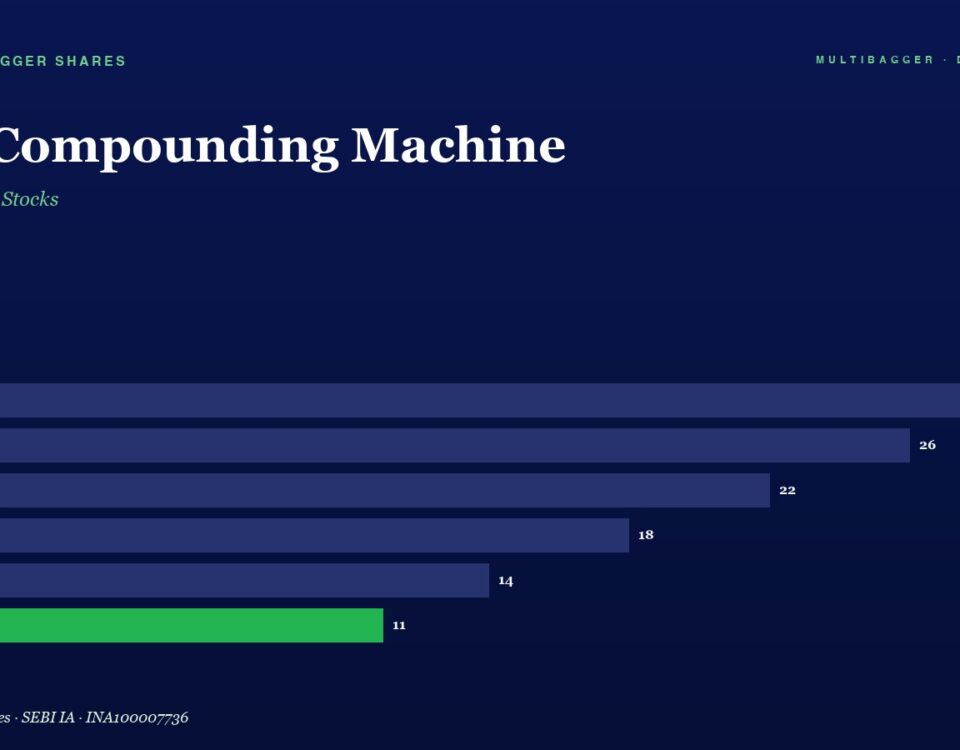
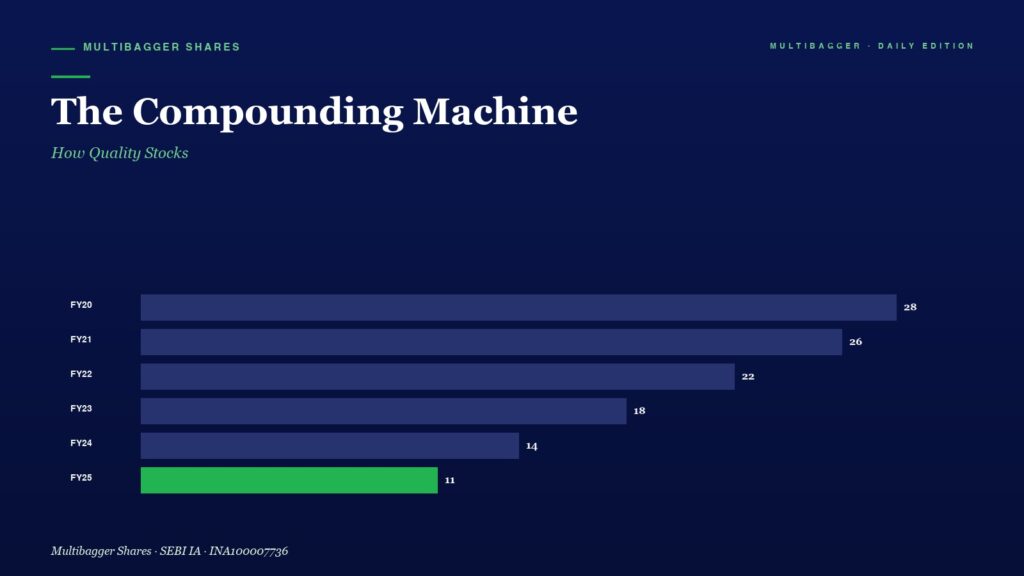
Title and subtitle: 'The Compounding Machine' with subtitle 'How Quality Stocks' on a dark blue background; below is a horizontal bar chart of FY20–FY25 values, with bars and right-aligned numbers 28, 26, 22, 18, 14, and a green 11 for FY25.

The Compounding Machine: How Quality Stocks

📅 Published March 20, 2026 (Friday) A comprehensive deep dive into quality compounding in Indian markets. Titan Biotech (BSE: 524717) delivered 50x returns — from ₹8 […]
+91-7380122211