Track Record of Identifying Rare Wealth CreatorsTrack Record of Identifying Rare Wealth Creators

Your blog category

March 25, 2026
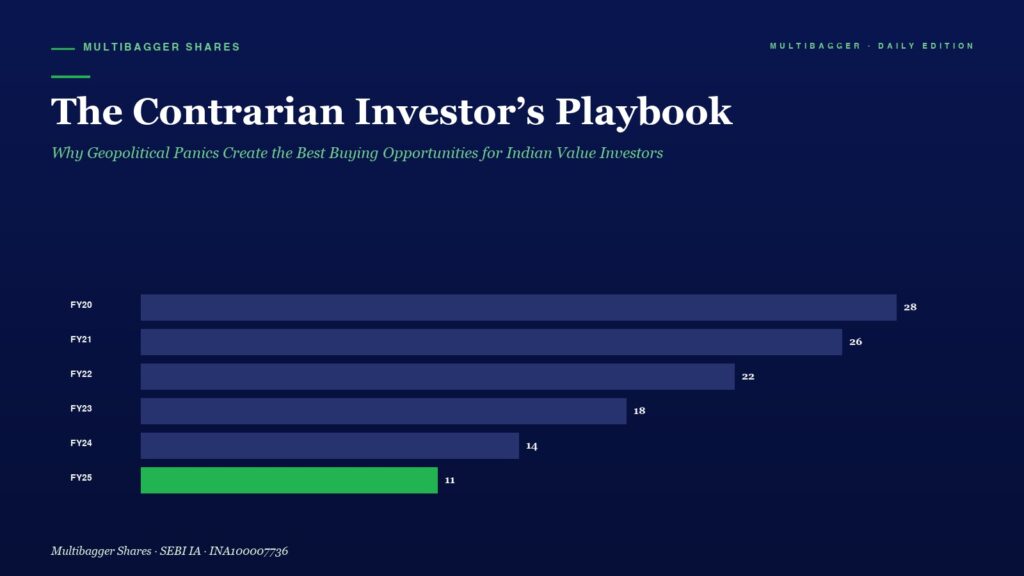
Header with title 'The Contrarian Investor’s Playbook' and subtitle about geopolitical panics; a dark blue page with a horizontal bar chart of FY20–FY25 showing values (FY25 in green).

The Contrarian Investor’s Playbook: Why Geopolitical Panics Create the Best Buying Opportunities for Indian Value Investors

📅 Published March 25, 2026 (Wednesday) Table of Contents Toggle When the World Panics, Smart Investors Accumulate What Exactly Is Contrarian Investing? The Historical Evidence: Geopolitical […]
March 25, 2026
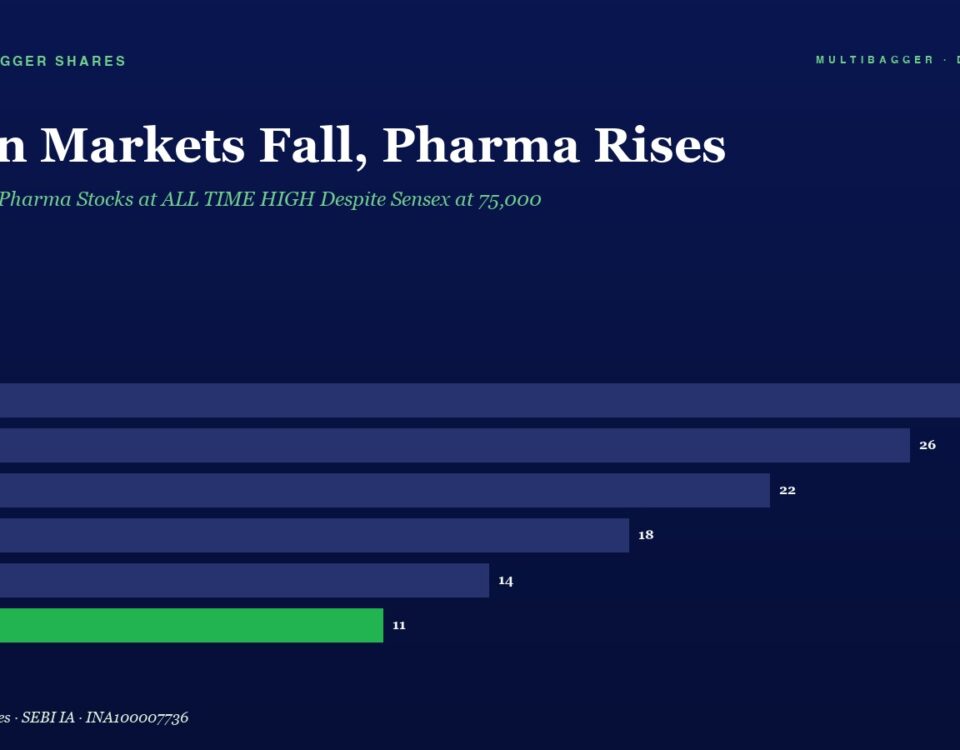
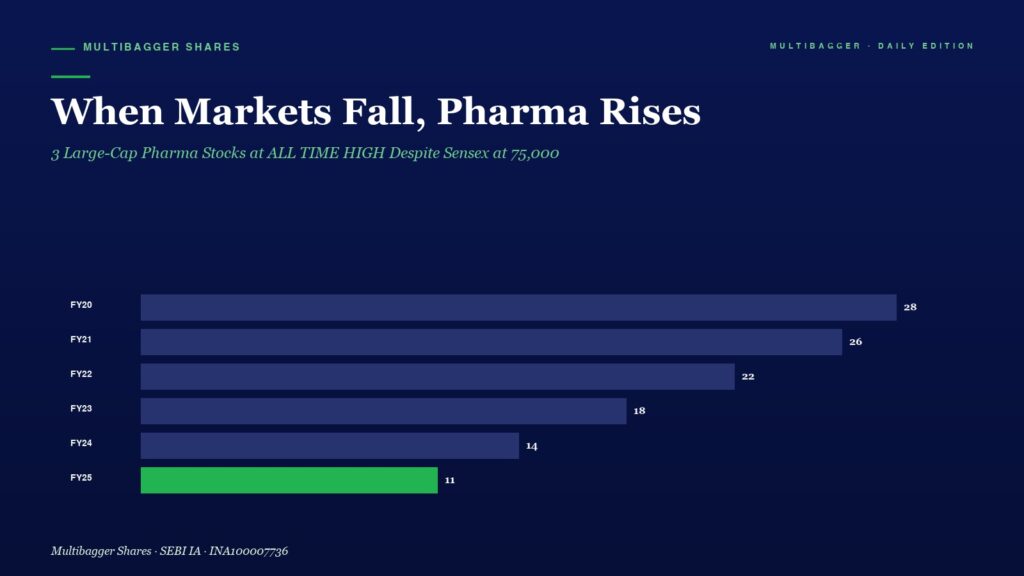
Infographic bar chart titled 'When Markets Fall, Pharma Rises' showing yearly values from FY20 to FY25. Blue bars decrease from FY20–FY24, with FY25 a green bar at 11, highlighting a rising pharma trend amid market drops.

When Markets Fall, Pharma Rises: 3 Large-Cap Pharma Stocks at ALL TIME HIGH Despite Sensex at 75,000

📅 Published March 25, 2026 (Wednesday) Table of Contents Toggle Capital Flows to Safety During Uncertainty The Proof Is in the Numbers What Do These Numbers […]
March 25, 2026
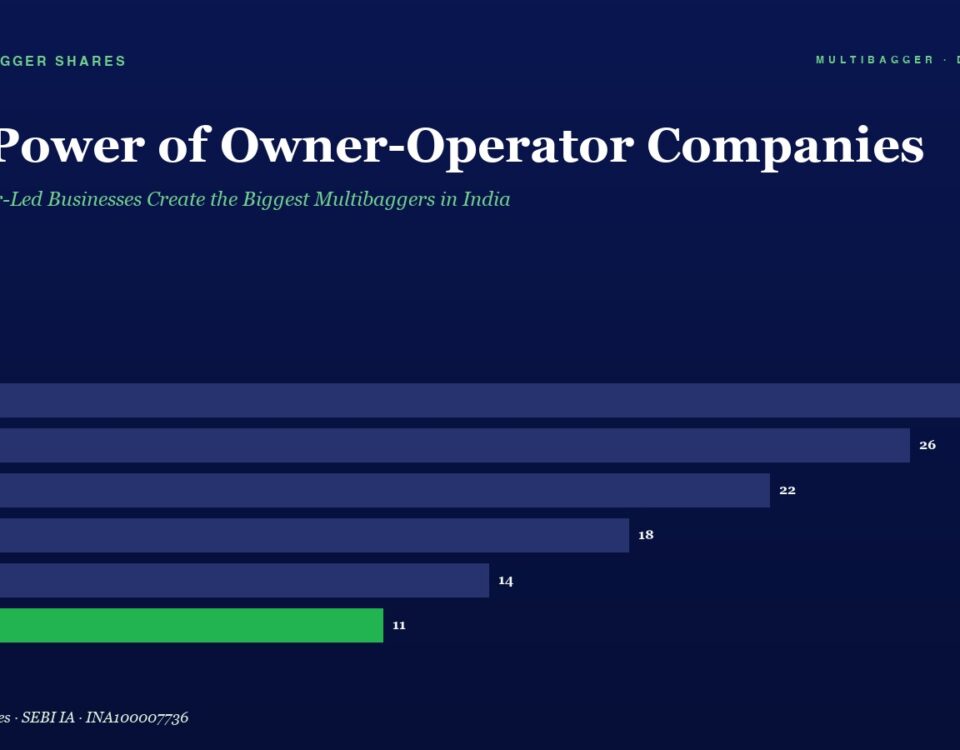
Horizontal bar chart of yearly figures from FY20 to FY25, with values FY20 28, FY21 26, FY22 22, FY23 18, FY24 14, FY25 11; FY25 bar is green.

The Power of Owner-Operator Companies: Why Founder-Led Businesses Create the Biggest Multibaggers in India

When the CEO's wealth is tied to YOUR wealth, magic happens. Learn how to identify owner-operator companies in India — the most powerful filter for finding multibagger stocks.
March 25, 2026
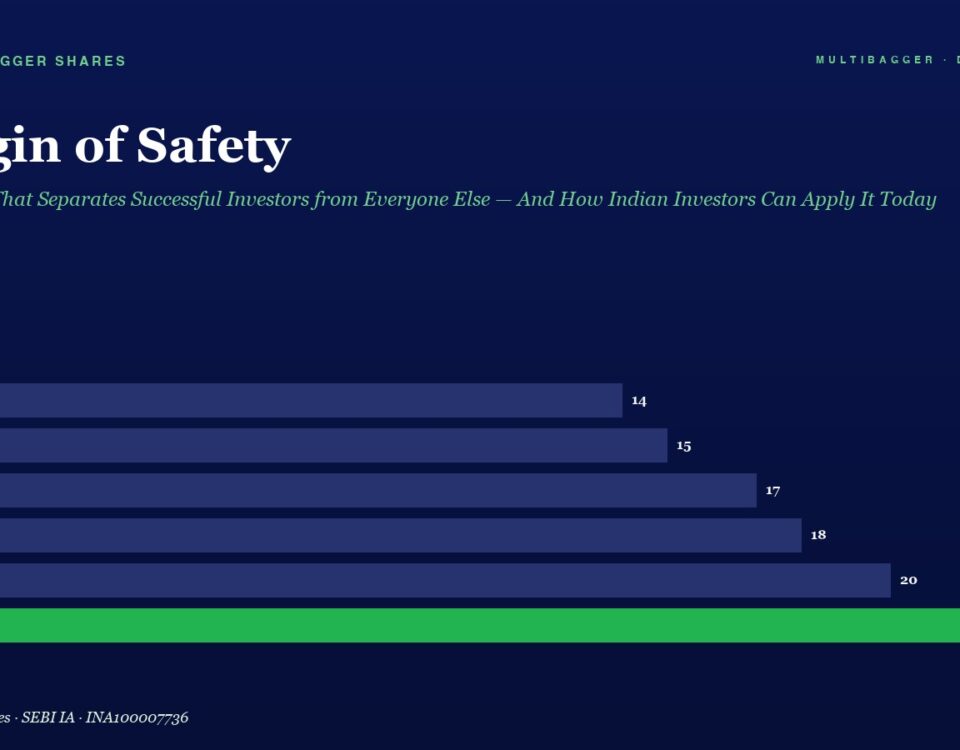
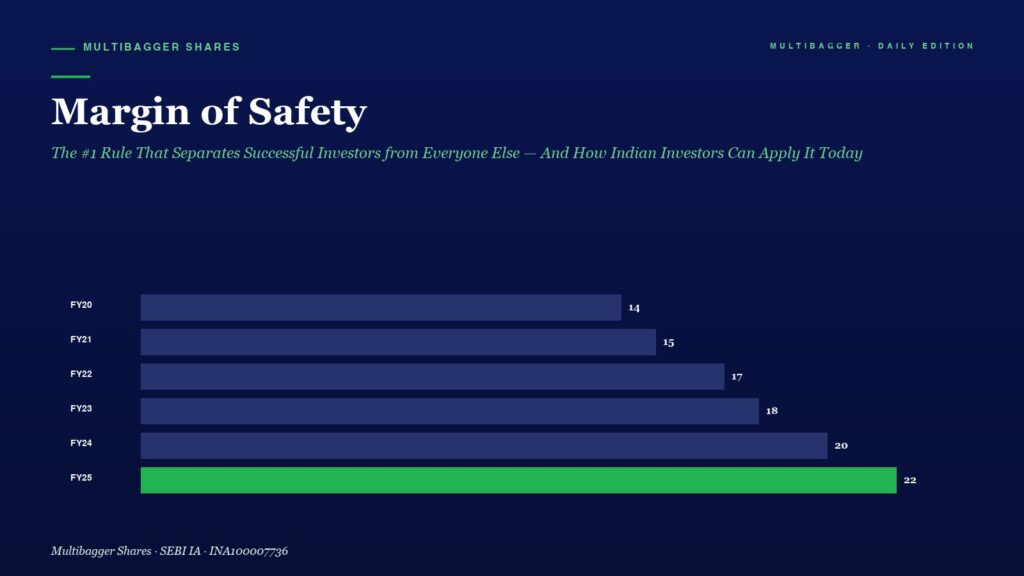
Infographic titled 'Margin of Safety' showing yearly bars (FY20–FY25); values rise from 14 to 22, with FY25 highlighted in green.

Margin of Safety: The #1 Rule That Separates Successful Investors from Everyone Else — And How Indian Investors Can Apply It Today

📅 Published March 25, 2026 (Wednesday) Table of Contents Toggle What Is Margin of Safety — And Why Should Every Indian Investor Obsess Over It? The […]
info@multibaggershares.com