Blog
Your blog category
March 30, 2026
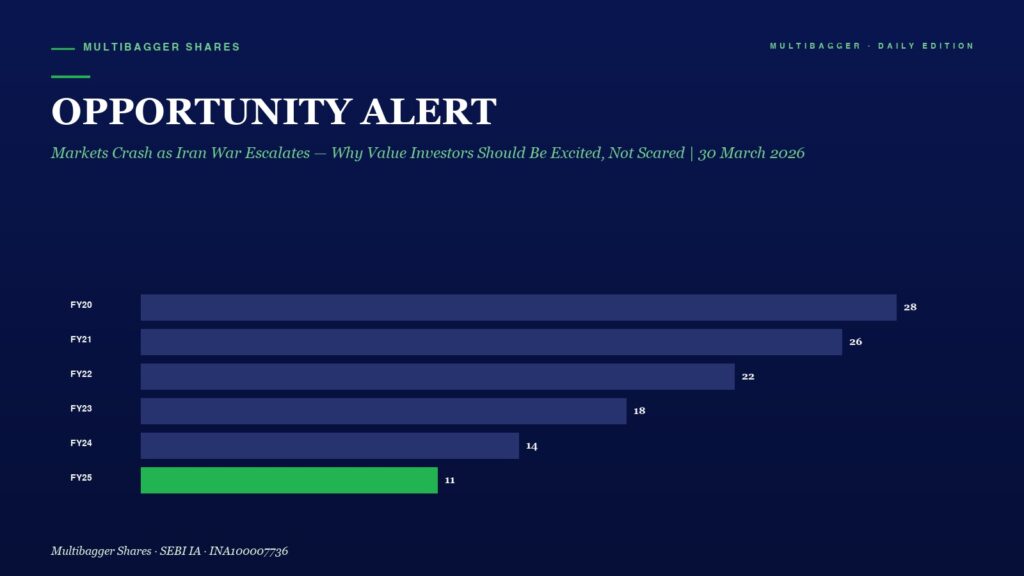
Sensex plunges 1,100+ points, Nifty breaks 22,500 as US-Iran war enters 5th week. Crude oil surges to $115. FIIs sell aggressively. But here's why this crash is an OPPORTUNITY for value investors. Daily market commentary by Manish Goel at multibaggershares.com.
March 30, 2026
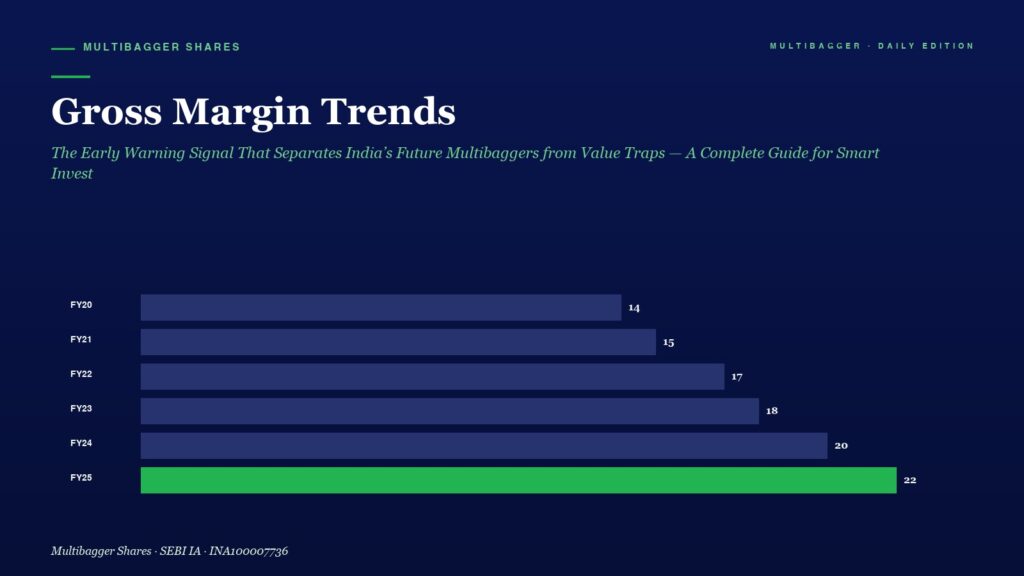
📅 PublishedMarch 30, 2026 (Monday) Table of Contents Toggle Why Most Investors Ignore the Most Powerful Early Warning Signal in Financial Statements What Exactly Is Gross […]
March 30, 2026
Charlie Munger built a latticework of mental models that turned him into Warren Buffett's secret weapon. Learn the 8 most powerful thinking frameworks every Indian investor needs — from Inversion to the Lollapalooza Effect — with practical applications for today's volatile market.
March 30, 2026
Warren Buffett says mistakes of omission are far bigger than mistakes of commission. If you sold a quality stock like HDFC Bank, Infosys or Asian Paints too early, buying it back at a higher price when fundamentals keep improving is the smartest move. Learn why from Buffett, Lynch, and Fisher.