Track Record of Identifying Rare Wealth CreatorsTrack Record of Identifying Rare Wealth Creators

Your blog category

April 3, 2026
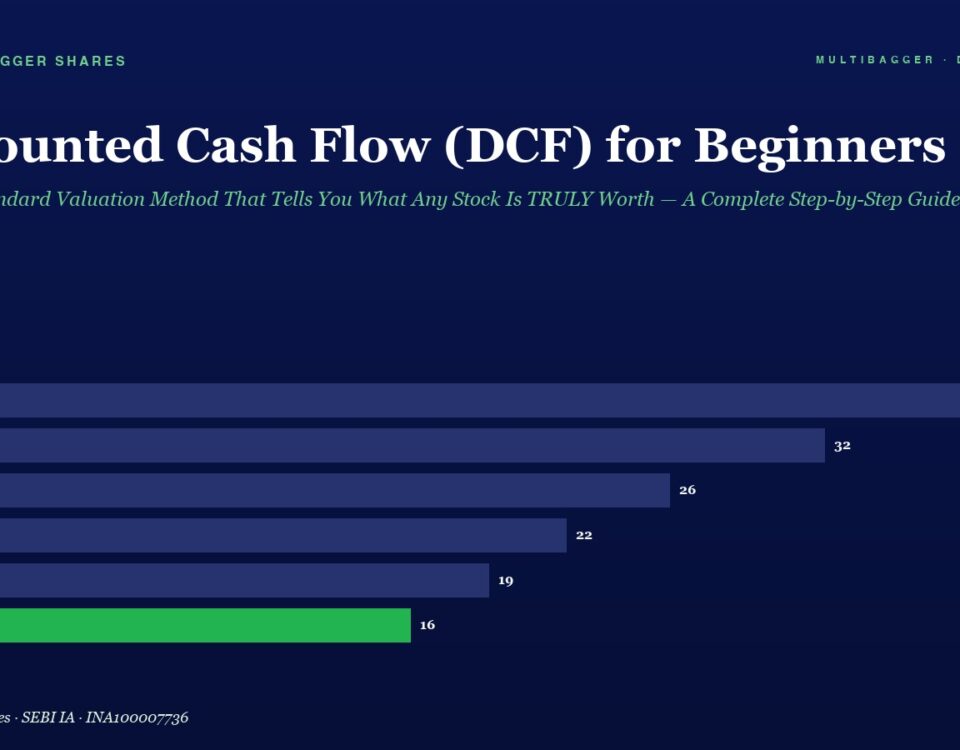
Bar chart of discounted cash flow (DCF) by fiscal year from FY20 to FY25, showing a decline from 38 to 16 (FY25 in green).

Discounted Cash Flow (DCF) for Beginners: The Gold Standard Valuation Method That Tells You What Any Stock Is TRULY Worth — A Complete Step-by-Step Guide for Indian Investors

📅 Published April 02, 2026 (Wednesday) Why Every Indian Investor Needs to Understand DCF — The Only Valuation Method That Answers “What Is This Stock Really […]
April 3, 2026
Infographic: Price-to-Book (P/B) Ratio bar chart from FY20 to FY25; bars show 38, 32, 26, 22, 19, and 16 (green) for FY25.

Price-to-Book (P/B) Ratio: The Fundamental Valuation Metric That Reveals Whether You’re Buying Indian Stocks at a Discount or Paying a Premium — A Complete Guide for Smart Value Investors

📅 Published April 03, 2026 (Friday) Introduction: Why Every Indian Investor Must Master the Price-to-Book Ratio In the universe of stock valuation metrics, few are as […]
April 3, 2026
Infographic: horizontal bar chart of annual figures FY20–FY25 on a dark blue background; FY25 shows a green bar with value 11, earlier years show 28, 26, 22, 18, and 14.

Happy Good Friday 2026! — From Manish Goel & Multibagger Shares

✝️ Happy Good Friday 2026! A Day of Reflection, Sacrifice & Hope Wishing you a peaceful and blessed Good Friday. This sacred day reminds us of […]
April 3, 2026
Episode 4 title on a dark blue page with a horizontal bar chart of yearly values FY20–FY25, ending with FY25 at 11 (green bar).

Episode 4: Benjamin Graham — The Father of Value Investing & His Indian Legacy | Value Investing Course

Episode 4: Benjamin Graham — The Father of Value Investing & His Indian Legacy Welcome to Episode 4 of the Complete Value Investing Course for Indian […]
info@multibaggershares.com