
Blog
Your blog category
April 16, 2026
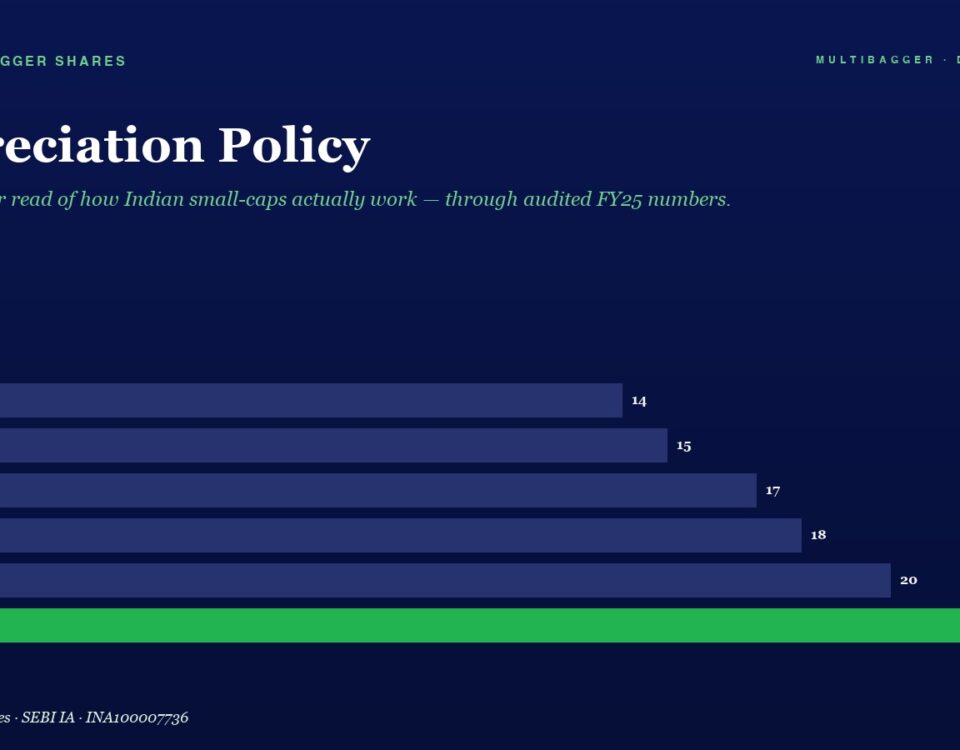
Deep-dive case study: Titan Biotech's decade-long depreciation-to-gross-block pattern reveals clean management accounting — the forensic test that separates real earnings from manipulated ones in Indian small-caps.
April 16, 2026
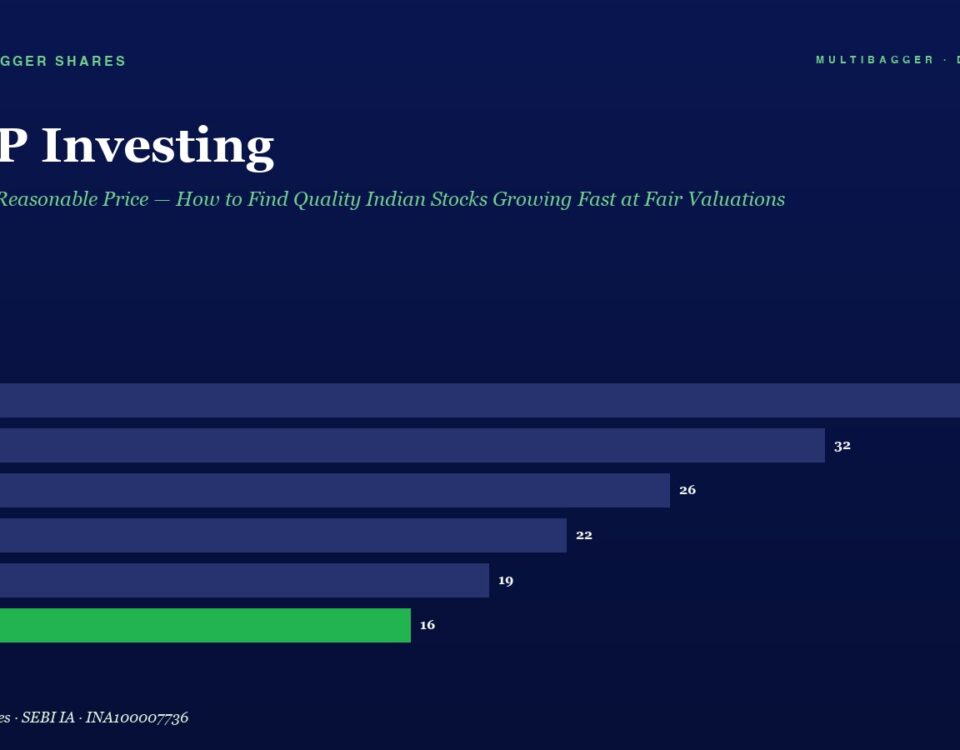
📅 Published April 16, 2026 (Thursday) Every Indian investor faces the same dilemma: pure value stocks look cheap but are often cheap for a reason, while […]
April 15, 2026
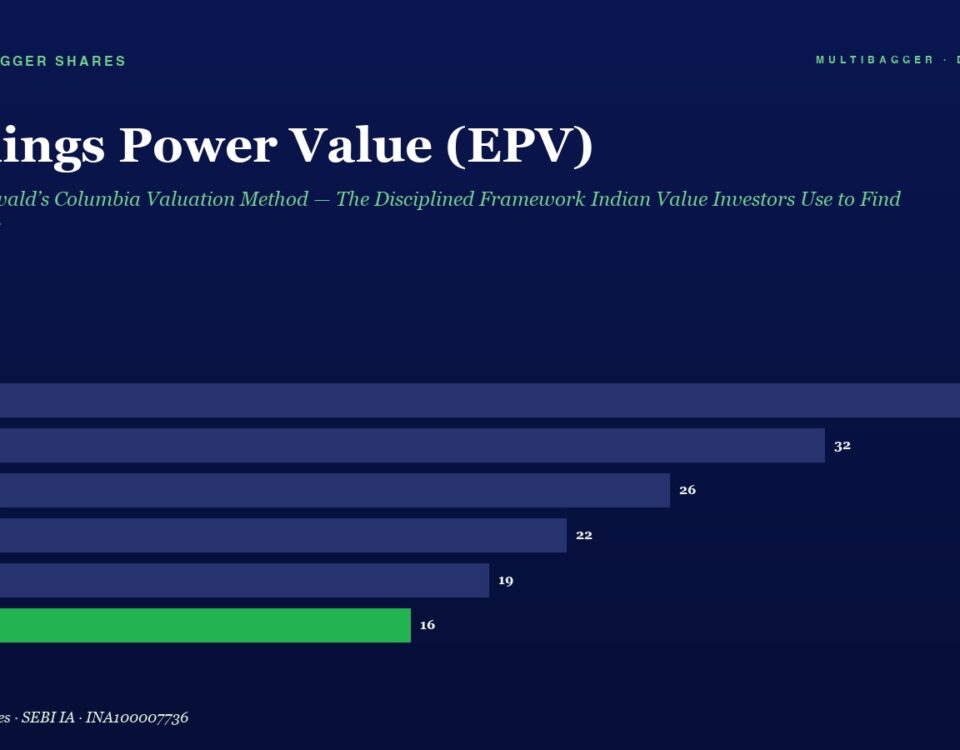
📅 Published April 15, 2026 (Wednesday) Why Most Indian Value Investors Are Using the Wrong Valuation Method Ask ten Indian value investors how they calculate the […]
April 15, 2026
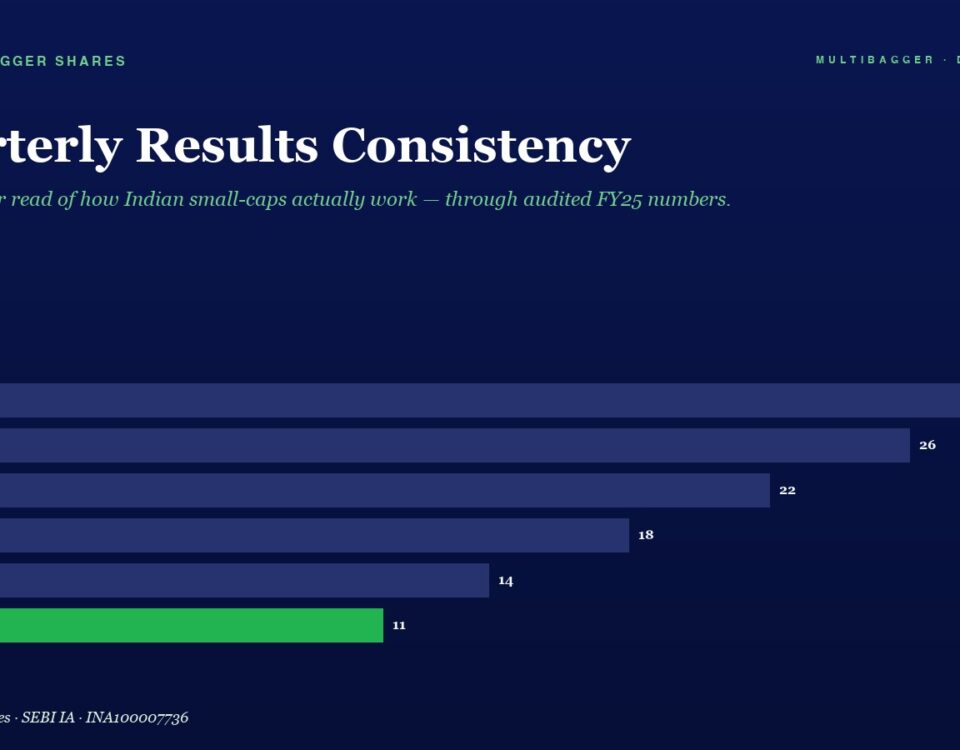
An expert deep-dive into Titan Biotech's live quarterly results (Jun 2024 – Dec 2025) from Screener.in. Why seven consecutive profitable quarters with a 680-bps OPM band expose the operational excellence that annual averages hide — and why quarter-over-quarter consistency is the most underused quality signal in Indian small-cap investing.


