Blog
Your blog category
March 31, 2026
The Availability Heuristic is one of the most dangerous cognitive biases in investing — it makes you buy stocks that are easy to recall, not stocks that are genuinely undervalued. Learn how to overcome it and find hidden multibaggers like Titan Biotech.
March 31, 2026
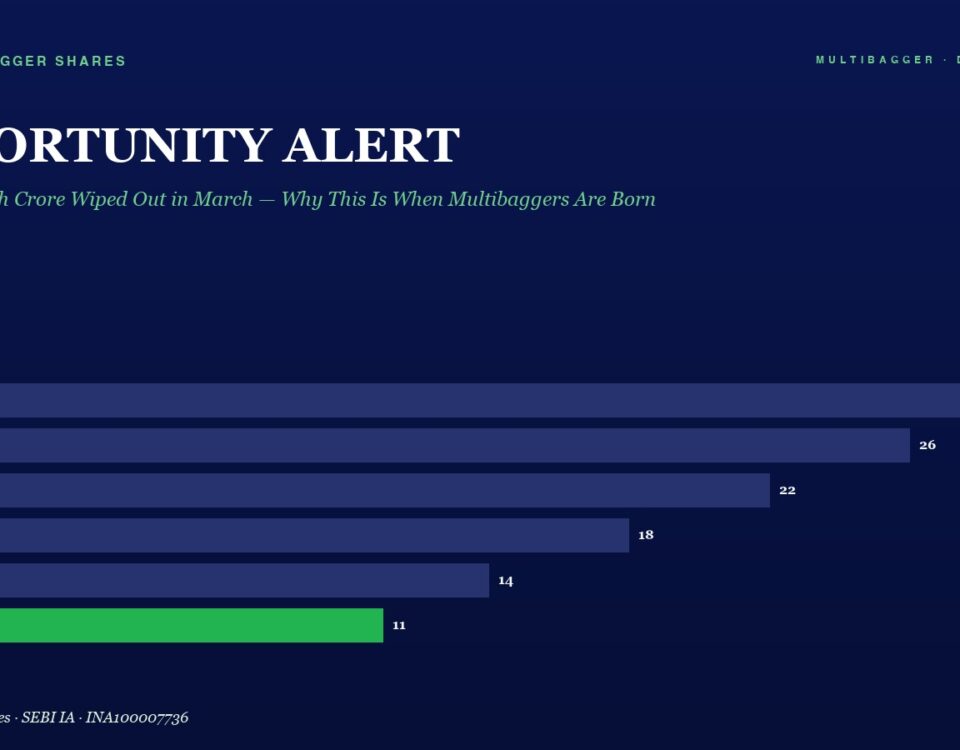
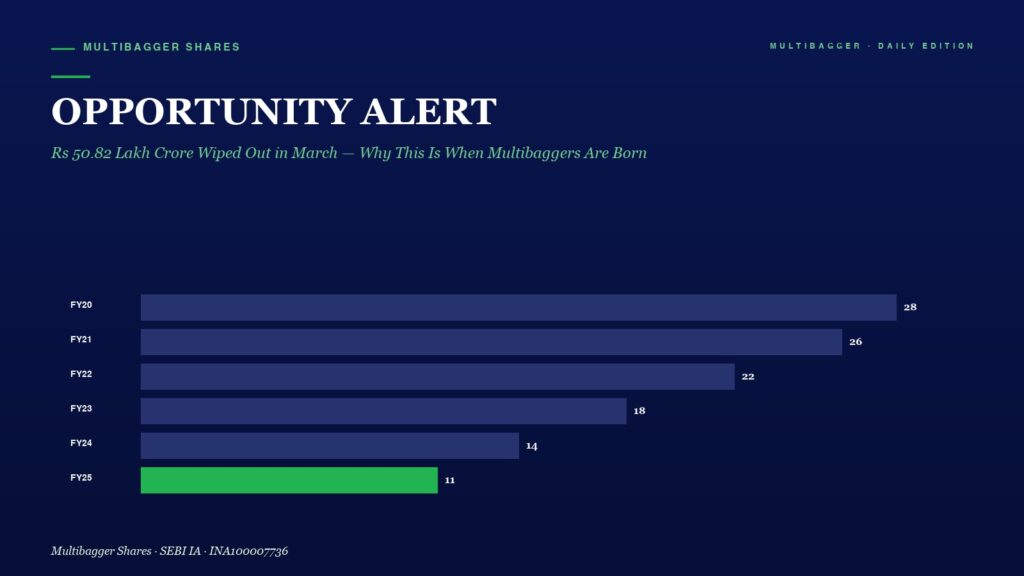
Sensex crashes 1,636 pts, Nifty below 22,331 as Iran war fears grip markets. Rs 50.82 lakh crore wiped in March. FIIs sell Rs 1.14 lakh crore. But history shows: this is when value investors build generational wealth. Here's your action plan.
March 31, 2026
📅 Published March 31, 2026 (Tuesday) Table of Contents Toggle The Most Dangerous Bias You’ve Never Heard Of What Exactly Is the Endowment Effect? The Neuroscience […]
March 30, 2026
Howard Marks built his fortune by mastering market cycles. With the Sensex crashing 1,635 points due to Iran war, his framework is more relevant than ever for Indian investors.