Track Record of Identifying Rare Wealth CreatorsTrack Record of Identifying Rare Wealth Creators

Your blog category

March 26, 2026
Dark blue hero image with the title 'Geopolitical Crises and Your Portfolio' and a horizontal bar chart of FY20–FY25 values (28, 26, 22, 18, 14, 11); FY25 bar is bright green.

Geopolitical Crises and Your Portfolio: Why Smart Value Investors Buy When Others Panic — Lessons from India’s Market History

📅 Published March 26, 2026 (Thursday) Table of Contents Toggle When the World Panics, the Wise Invest The Historical Pattern: Every Crisis is a Buying Opportunity […]
March 26, 2026
Infographic: Ram Navami Special headline with a fiscal bar chart showing yearly values from FY20 to FY25, final FY25 in green (11).

Ram Navami Special: Markets Closed Today — What Yesterday’s 1,200-Point Sensex Rally Means for Your Portfolio

📅 Published March 26, 2026 (Thursday) 🪔 Ram Navami Holiday Edition Markets Closed Today Table of Contents Toggle Market Snapshot — Last Session: Wednesday, March 25, […]
March 26, 2026
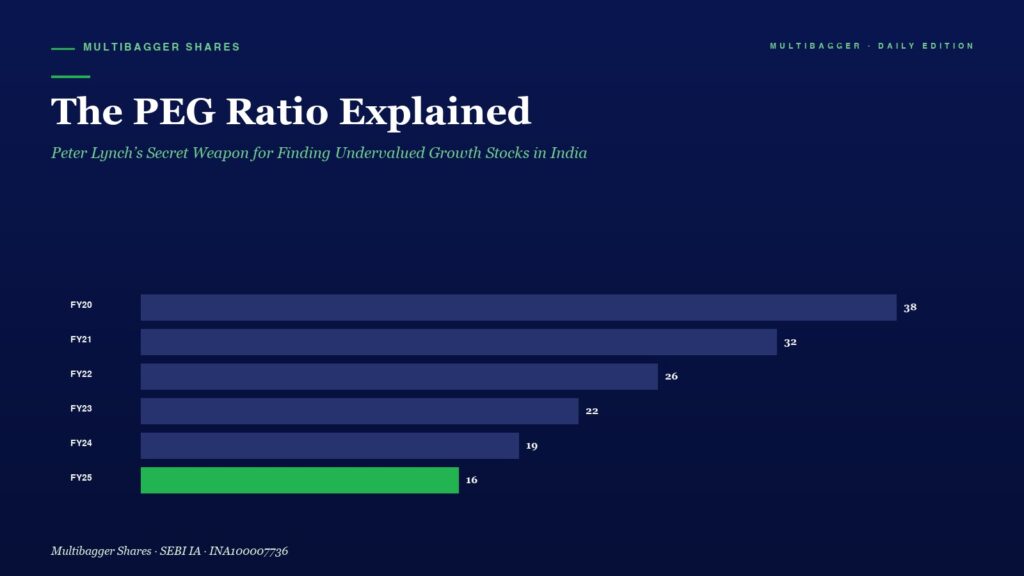
Infographic: The PEG Ratio Explained with horizontal bars for FY20–FY25; values drop from 38 to 16, with FY25 bar in green and a title/subtitle at top.

The PEG Ratio Explained: Peter Lynch’s Secret Weapon for Finding Undervalued Growth Stocks in India

📅 Published March 26, 2026 (Thursday) Table of Contents Toggle Why the P/E Ratio Alone Can Mislead You What Is the PEG Ratio? Why the PEG […]
March 25, 2026
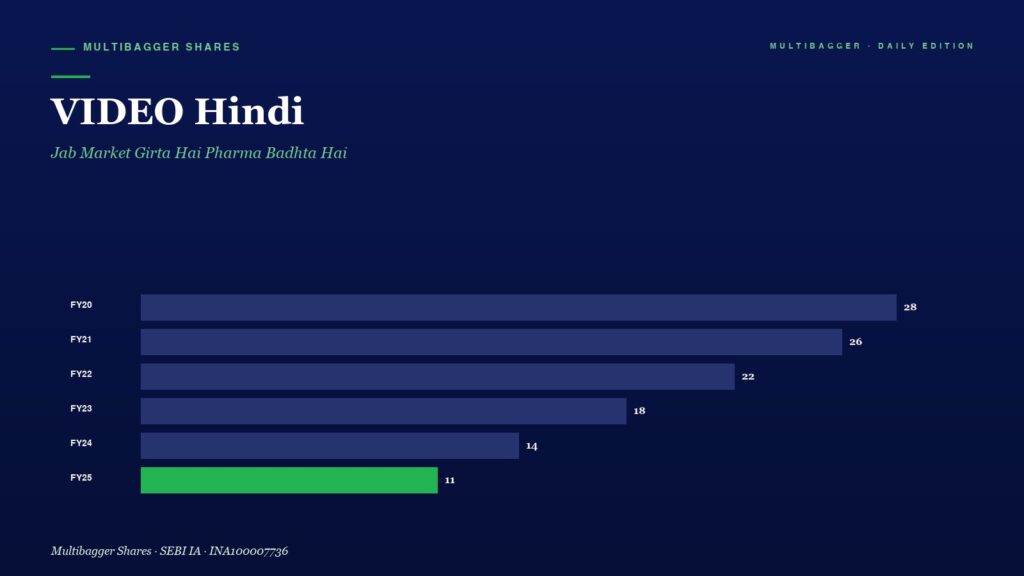
Bar chart of Multibagger Shares by fiscal year (FY20–FY25); values shown on the right, with FY25 highlighted in green at 11.

VIDEO Hindi: Jab Market Girta Hai Pharma Badhta Hai

📅 Published March 25, 2026 (Wednesday) Table of Contents Toggle Jab Market Girta Hai, Pharma Badhta Hai! Poori Analysis Dekhein (Hindi Mein) Video Ki Mukhya Baatein: […]
info@multibaggershares.com