Blog
Your blog category
April 8, 2026
Titan Biotech earns ₹53.90 crore from overseas markets across 100+ countries — 34.5% of total revenue. With a 3:1 forex earned-to-used ratio and a net forex surplus of ₹35.75 crore, this small-cap has built genuine international competitive strength. A deep-dive case study.
April 8, 2026
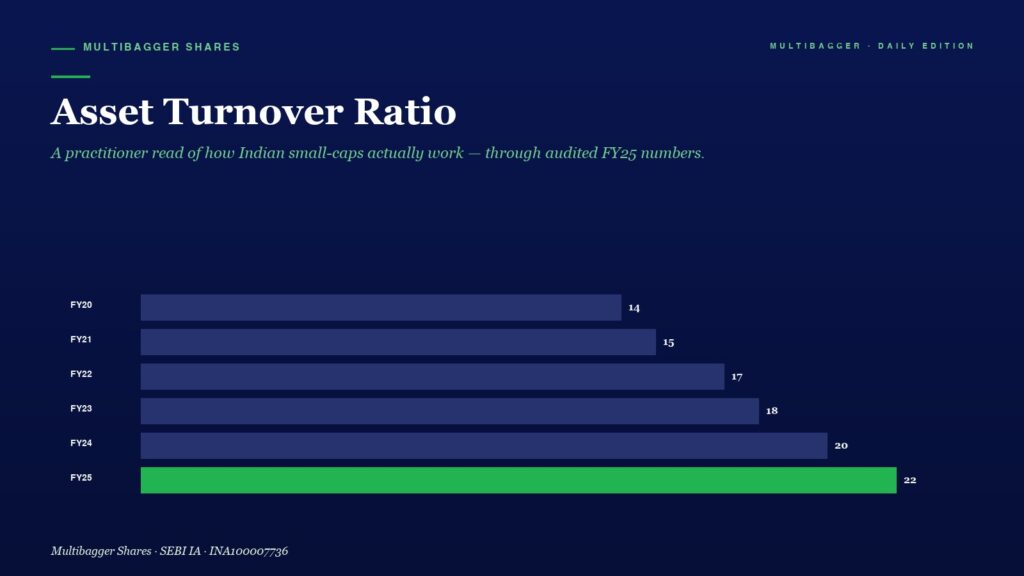
Titan Biotech's Asset Turnover Ratio tells a powerful story: from 1.18x in FY2015 to a peak of 1.42x during COVID demand to 0.94x during the current capex phase. A deep-dive case study.
April 8, 2026
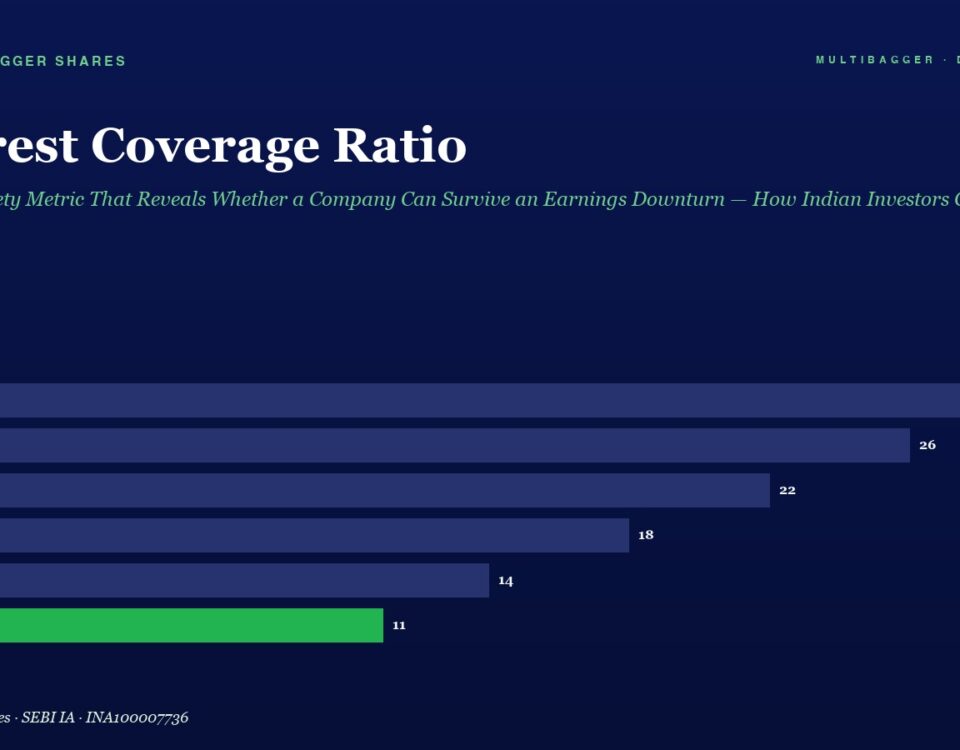
📅 Published April 08, 2026 (Wednesday) Why Most Indian Retail Investors Ignore the One Ratio That Could Save Them from Catastrophic Losses The Indian stock market […]
April 8, 2026
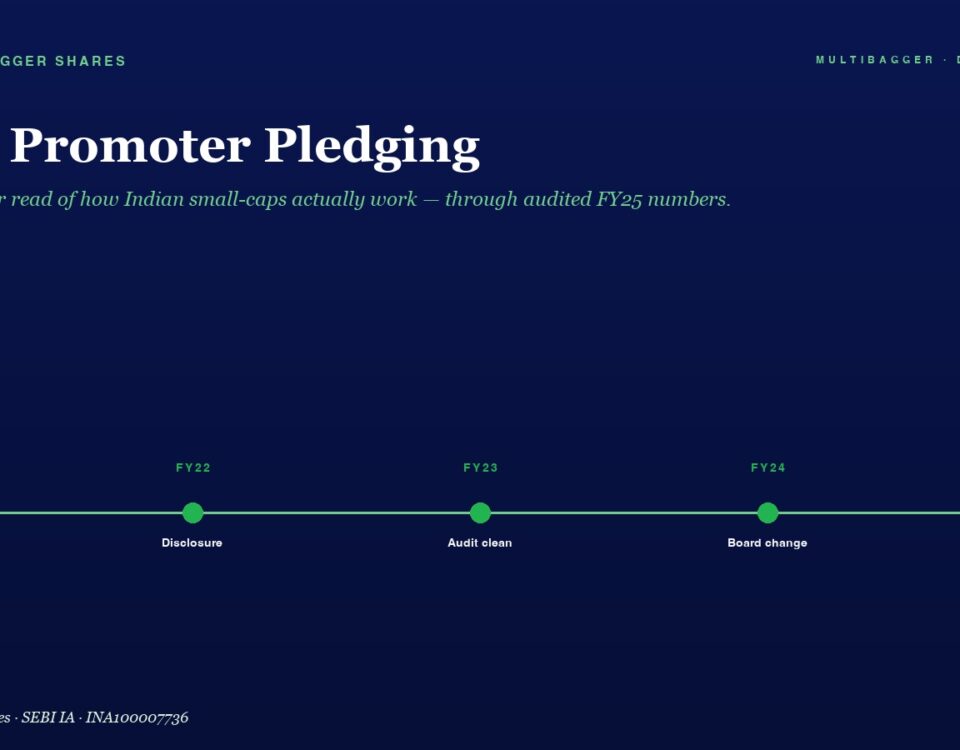
In the Indian stock market, there is one silent killer that has destroyed more retail investor wealth than any market crash, any earnings miss, or any […]