Blogs

June 3, 2026
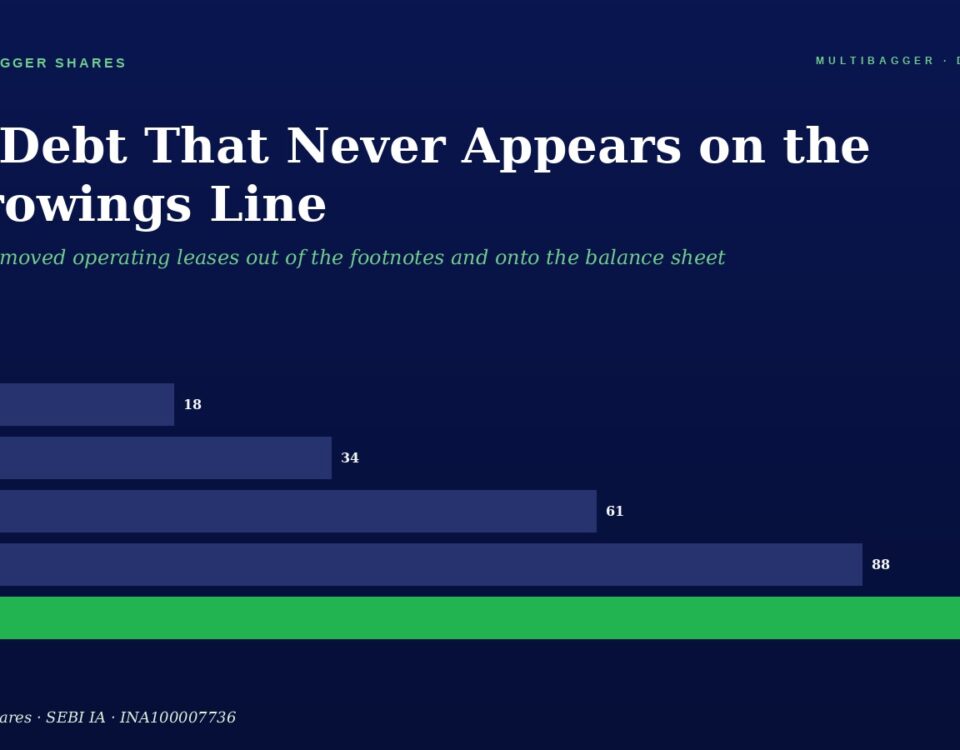
Infographic Showing Debtfcf Multipliers by Category Fortress 150x Comfortable 095x Stretched 055x Distressed 018x and a Fy25 Marker Around 12x for Cfo to debt

Cash Flow From Operations to Total Debt Ratio: The Credit-Analyst’s 60-Second Solvency Test That Separates Self-Liquidating Balance Sheets From Slow-Bleed Leverage Time Bombs

The Cash Flow From Operations to Total Debt ratio — CFO divided by Total Borrowings — is the single most under-appreciated solvency test in Indian fundamental analysis. This article walks through the formula, two contrasting cases, and a dedicated FY25 audited case study.
June 2, 2026
Cover Page of Multibagger Shares Issue 301 Cash  Equivalents  Market Cap with a Circular Donut Chart Showing 17 Cash Slice and Legends for Liquidity and Operating Business Accessors

Cash & Equivalents as a Percentage of Market Cap: The Graham-Era Deep-Value Forensic Test That Reveals How Much You’re Actually Paying for the Operating Business

The Graham-era forensic test that asks: of every rupee you pay for a share, how many paisa are simply cash sitting in the company's bank account? An educational illustration using Titan Biotech FY25 audited numbers as a positive case study.
June 1, 2026
Title and Subtitle of a Metrics Graphic Goodwill to net worth Ratio the Forensic Balance sheet Test did Indian Companies Build Earnings or Buy Them at a Premium with a Four bar Chart Cleanorganic 8 Moderate Inorganic 22 Acquired heavy 38 Roll up Risk 62 on a Dark Blue Gradient Background

Goodwill-to-Net-Worth Ratio: The Forensic Balance-Sheet Test That Reveals Whether Indian Companies Bought Their Earnings Or Built Them Organically

How one balance-sheet line — Goodwill on Consolidation — reveals whether Indian companies grew their earnings organically or simply purchased them at a premium. A forensic FY25 walkthrough with an organically-built reference set, including Ind AS 36 impairment-test signals and four common traps.
May 31, 2026
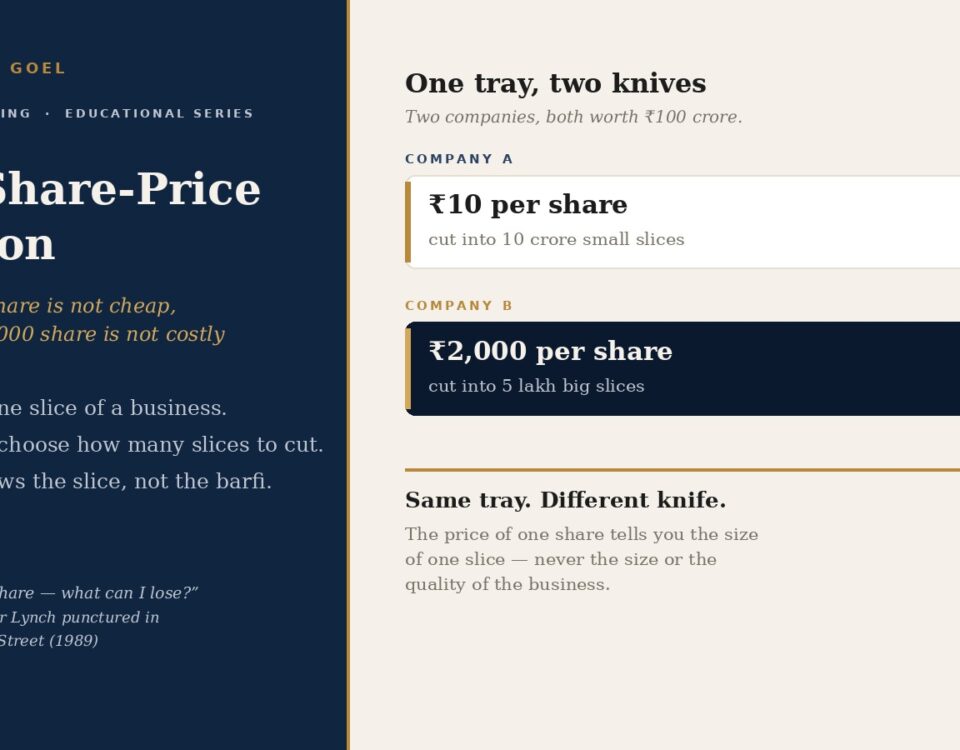
Hero Layout Showing a Left Dark blue Panel with the Headline days Payable Outstanding the Working capital Ratio That Reveals Negotiating Power or Hidden Liquidity Stress and a Right Beige Panel Containing a Bar Chart Titled illustrative Dpo Range Across Indian Sectors days with Four Bars It Services 42 Pharma 78 Mid cap Engg 110 Fmcg 120

Days Payable Outstanding: The Working-Capital Ratio That Reveals Negotiating Power or Hidden Liquidity Stress

Days Payable Outstanding (DPO) measures how long a company takes to pay suppliers. Rising DPO can mean franchise-level negotiating power — or hidden liquidity distress. Here is how to tell which, with an FY25 Indian biotech illustration.
+91-8448836436