Blogs
May 11, 2026
Edward Thorndike documented the halo effect in 1920; Phil Rosenzweig's 2007 book showed it runs backward in business commentary. We unpack the five Indian retail-investor halo channels, share a five-step de-haloing checklist, and use Titan Biotech FY25's nine decorrelated disclosed markers as an illustrative anti-halo process case study.
May 11, 2026
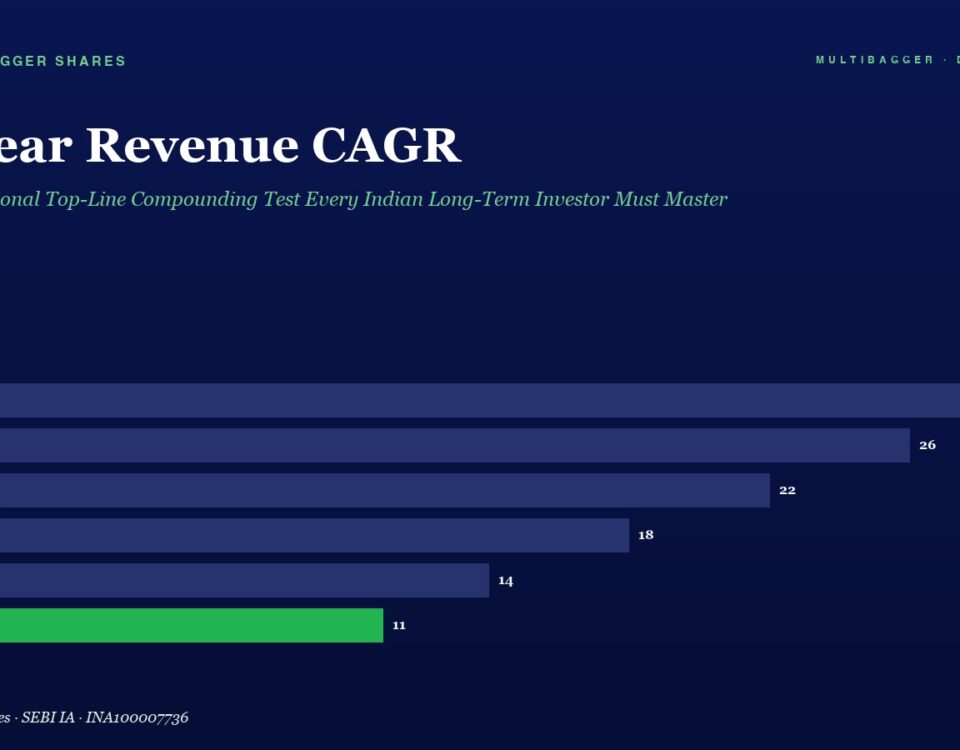
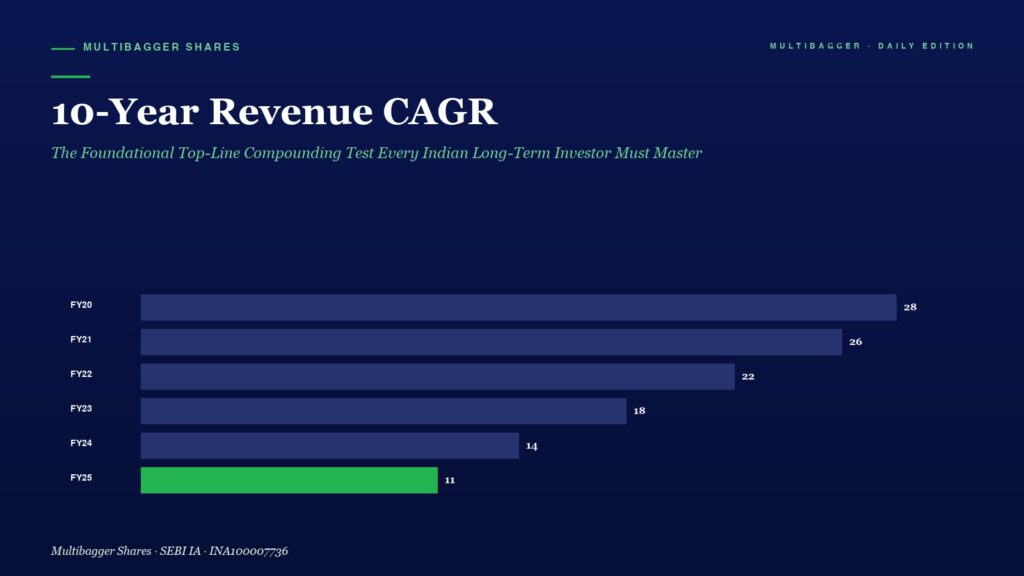
How to read a 10-year Revenue CAGR through four disciplined lenses — illustrated with Titan Biotech FY25 audited numbers (~15% Revenue CAGR, ~29% PAT CAGR, ~103% CFO/OP, Rs.3 Cr borrowings). Educational only.
May 11, 2026
Charlie Munger's 1995 cognitive-bias #14 — the envy tendency — is the single cleanest explanation for India's ₹1.81 lakh crore F&O losses. Titan Biotech FY25's audited numbers read as a corporate version of the same discipline.
May 10, 2026
The Planning Fallacy systematically tricks investors into underestimating time, cost, and risk while overestimating benefits. Indian retail data shows the bias is alive and expensive — median expected returns of 18-22% versus actual Nifty 50 TR of 13.4%. The remedy is Reference-Class Forecasting. Titan Biotech FY25 illustrative numbers — Rs.3 cr borrowings (down 81%), 103% CFO/Operating Profit, paced capex over a decade.