Blogs
April 28, 2026
Sir John Templeton's 'buy at the point of maximum pessimism' rule is the most uncomfortable, most lucrative discipline in value investing. Here's how Indian value investors can apply it in 2026 — and why durable, debt-free compounders are the right business-side filter.
April 27, 2026
Free Cash Flow Margin = (CFO − Capex) ÷ Revenue. Titan Biotech FY25 audited CFO/Operating Profit 103%, ₹3 Cr borrowings, ~₹214 Cr revenue — educational illustration of disciplined cash generation.
April 27, 2026
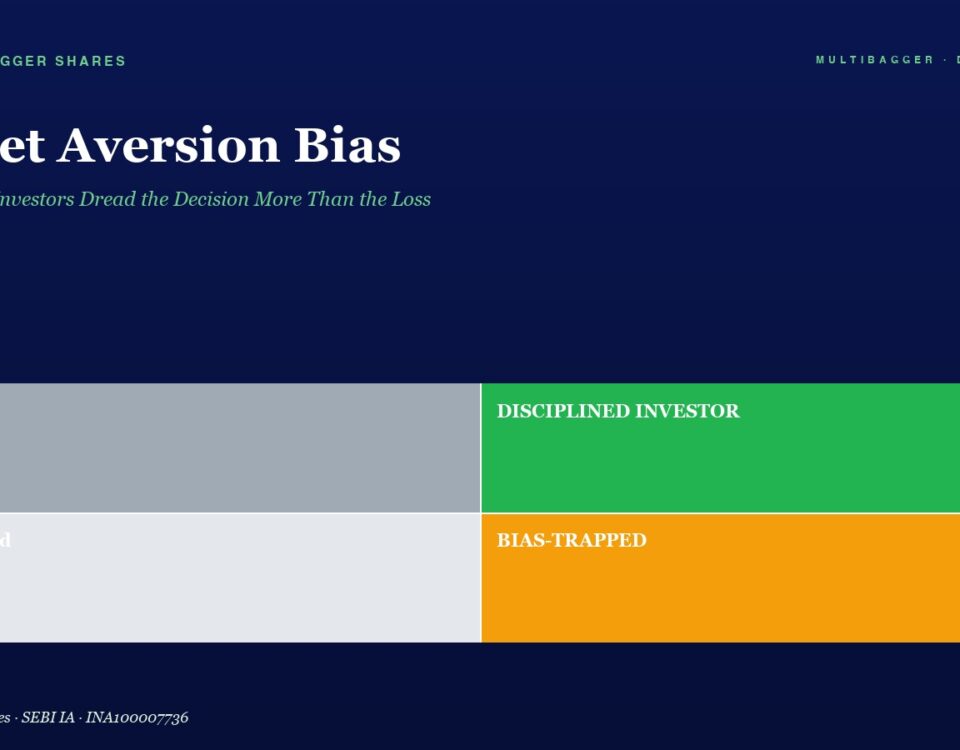
Regret aversion — the dread of taking a decision that will look like a mistake in hindsight — explains why Indian retail wealth stays parked in low-real-return FDs while equity SIPs deliver 14–16% CAGR. This article unpacks Bell (1982) and Loomes-Sugden (1982) regret theory, the Indian retail manifestations across SEBI/AMFI data, six structural counter-measures, and an illustrative case study of how Titan Biotech FY25 audited numbers (₹3 Cr borrowings, 103% CFO/Operating Profit, 36.4% independent board) demonstrate anti-regret process discipline at the corporate level.
April 26, 2026
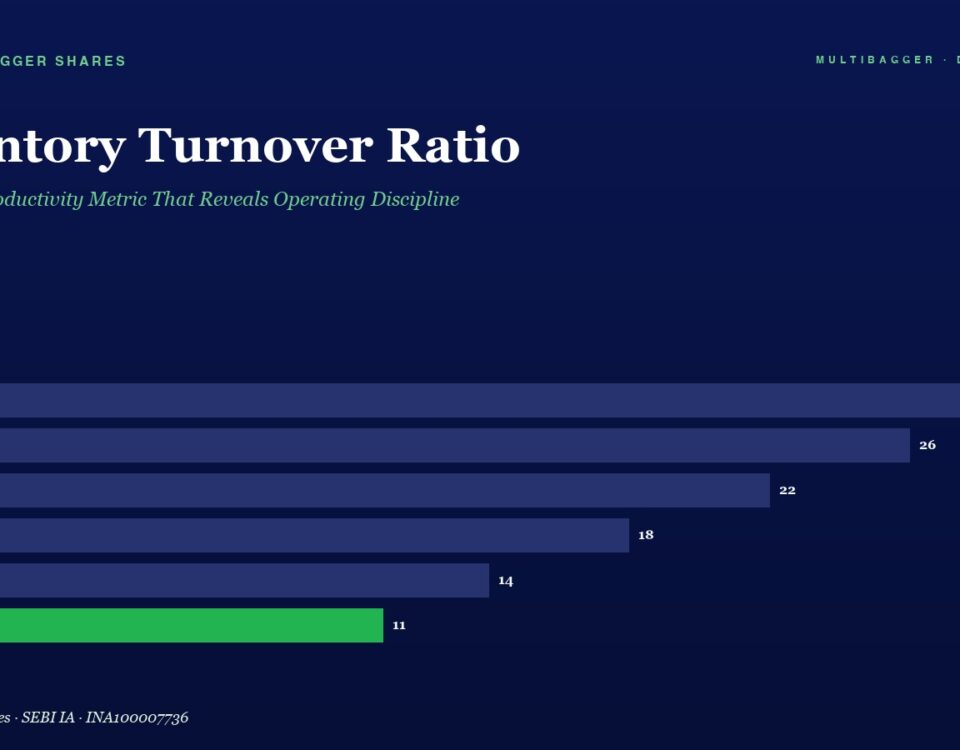
Inventory Turnover (COGS ÷ Average Inventory) is the most diagnostic working-capital metric on any Indian annual report — high turnover means each rupee of stock generates more sales, falling turnover often warns of an earnings shock 12–18 months in advance. Titan Biotech FY25's ~103% CFO/Operating Profit, sequential QoQ revenue lift, and ~₹3 Cr borrowings illustrate disciplined inventory management in a long-cycle biotech manufacturer.