Blogs
April 11, 2026
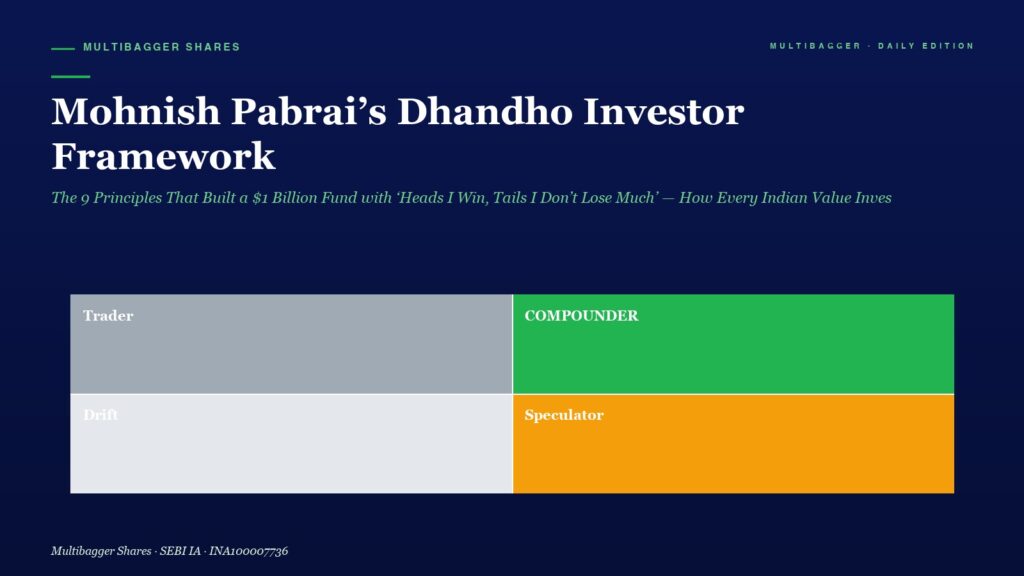
📅 Published April 11, 2026 (Saturday) Why Mohnish Pabrai Matters for Every Indian Value Investor If you had handed Mohnish Pabrai ₹1 crore in July 1999 […]
April 11, 2026
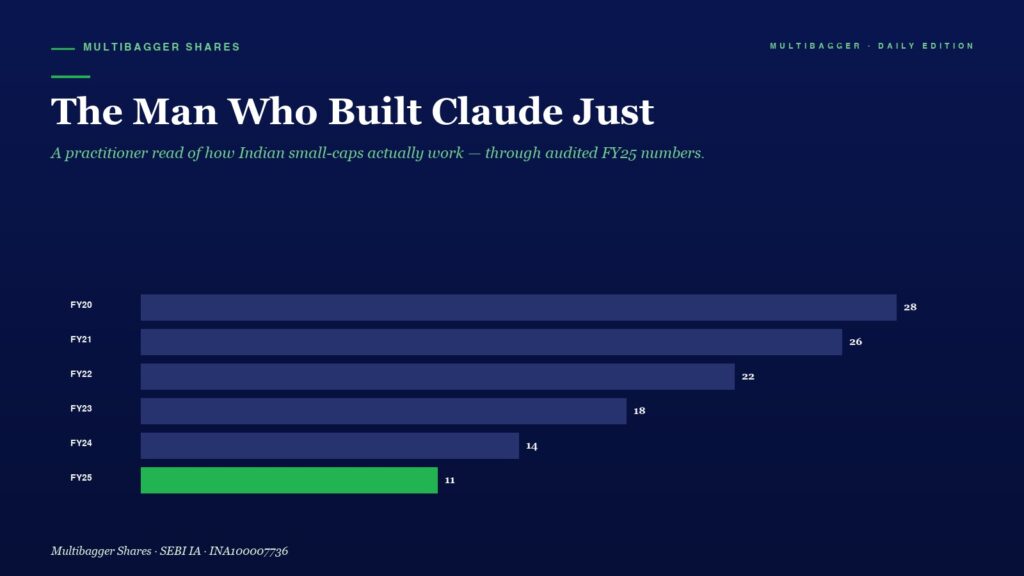
Dario Amodei, CEO of Anthropic, just declared on Nikhil Kamath's People by WTF podcast that biotech is about to have a renaissance driven by AI. Demis Hassabis, Sam Altman and Vinod Khosla independently agree — and are putting their own capital behind it. Here is what it means for the Indian long-term investor.
April 11, 2026
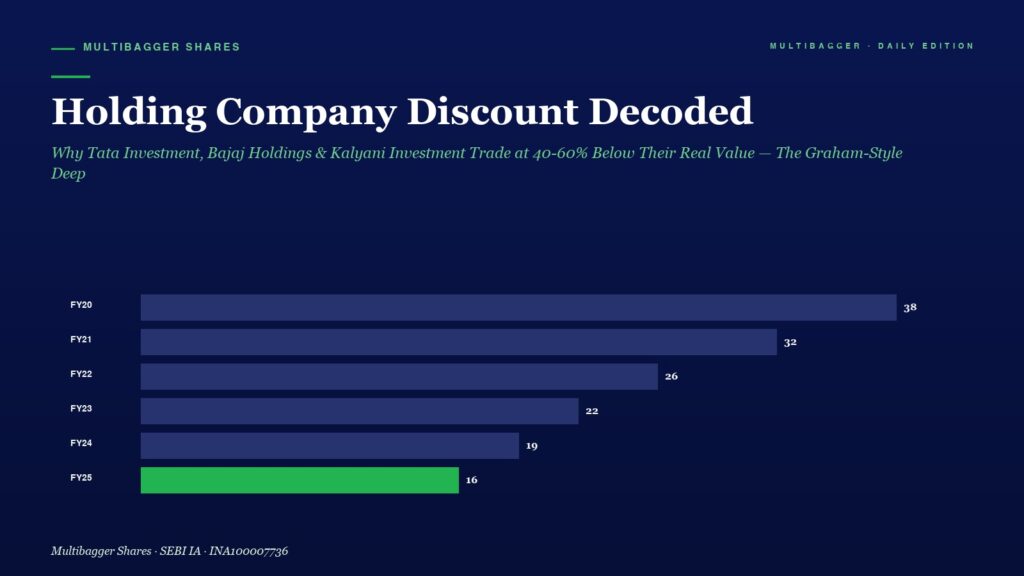
Discover why Indian holding companies like Tata Investment, Bajaj Holdings, and Kalyani Investment trade at 40-60% discounts to their real NAV — and the step-by-step framework smart value investors use to separate genuine bargains from permanent value traps.
April 11, 2026
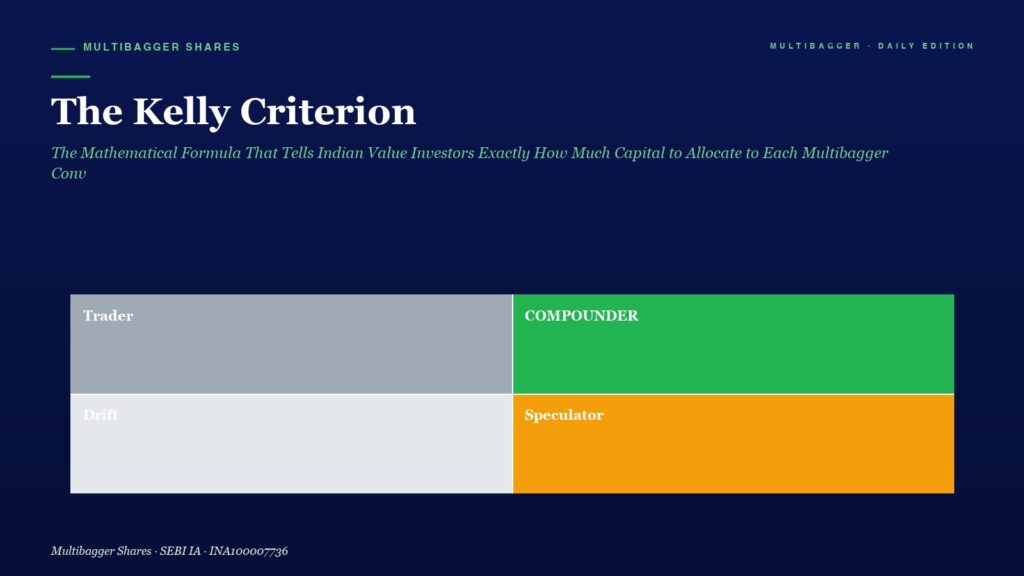
Stock picking is only half the battle — bet sizing is the other half. Discover how the Kelly Criterion, the mathematical formula used by Warren Buffett, Charlie Munger, Edward Thorp and Mohnish Pabrai, tells you exactly how much capital to allocate to each high-conviction multibagger. The math behind concentrated investing decoded for Indian value investors.